| Red | Green | Blue | |
| z | 17.64 | ||
| znorm | Inf | ||
| sky | -Inf | -Inf | -Inf |
| S/N | 28.0 | 45.7 | 49.3 |
| S/N(c) | 0.0 | 0.0 | 0.0 |
| SN(E/C) |
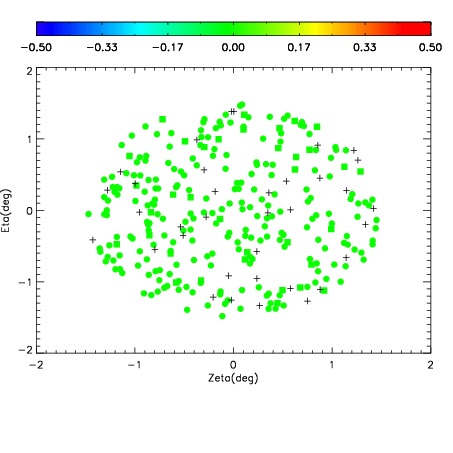
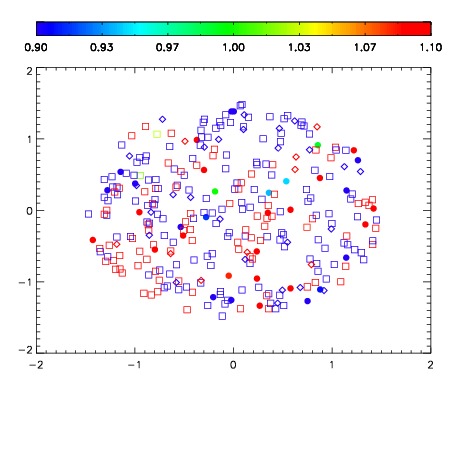
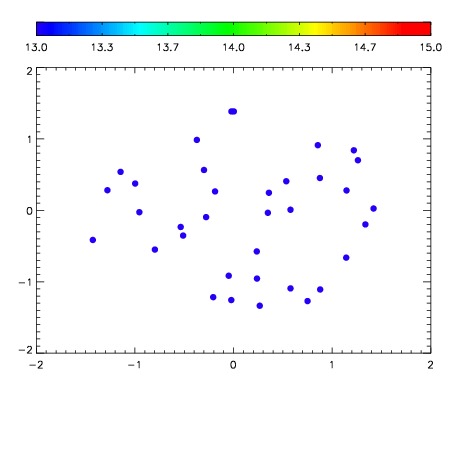

| Frame | Nreads | Zeropoints | Mag plots | Spatial mag deviation | Spatial sky 16325A emission deviations (filled: sky, open: star) | Spatial sky continuum emission | Spatial sky telluric CO2 absorption deviations (filled: H < 10) | |||||||||||||||||||||||
| 0 | 0 |
|
|
|
|
|
|
| IPAIR | NAME | SHIFT | NEWSHIFT | S/N | NAME | SHIFT | NEWSHIFT | S/N |
| 0 | 06640031 | 0.485207 | 0.00000 | 18.9780 | 06640029 | -0.000707853 | 0.485915 | 18.9877 |
| 1 | 06640026 | 0.482137 | 0.00307000 | 18.9941 | 06640028 | 0.000880911 | 0.484326 | 19.0441 |
| 2 | 06640027 | 0.482409 | 0.00279799 | 18.9502 | 06640025 | 0.00000 | 0.485207 | 18.9738 |
| 3 | 06640030 | 0.484553 | 0.000653982 | 18.9404 | 06640032 | -0.00105247 | 0.486259 | 18.9578 |