| Red | Green | Blue | |
| z | 17.64 | ||
| znorm | Inf | ||
| sky | -NaN | -NaN | -Inf |
| S/N | 28.7 | 47.0 | 50.6 |
| S/N(c) | 0.0 | 0.0 | 0.0 |
| SN(E/C) |
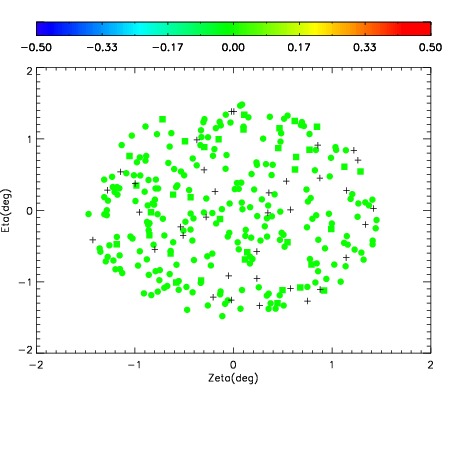
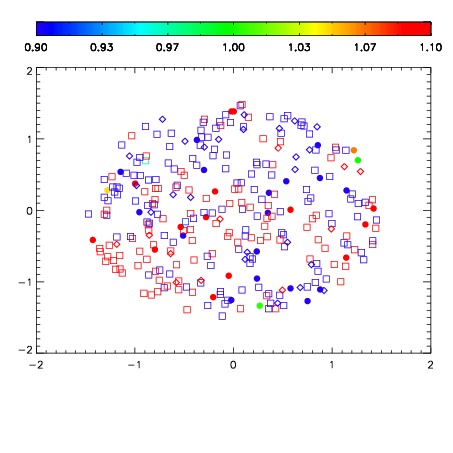
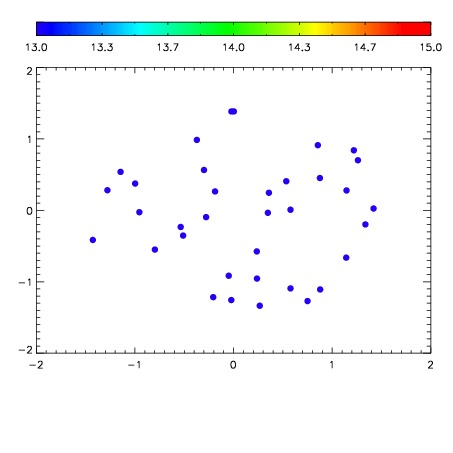

| Frame | Nreads | Zeropoints | Mag plots | Spatial mag deviation | Spatial sky 16325A emission deviations (filled: sky, open: star) | Spatial sky continuum emission | Spatial sky telluric CO2 absorption deviations (filled: H < 10) | |||||||||||||||||||||||
| 0 | 0 |
|
|
|
|
|
|
| IPAIR | NAME | SHIFT | NEWSHIFT | S/N | NAME | SHIFT | NEWSHIFT | S/N |
| 0 | 06940012 | 0.498387 | 0.00000 | 18.9794 | 06940018 | 0.000552800 | 0.497834 | 19.0075 |
| 1 | 06940016 | 0.496955 | 0.00143200 | 19.1147 | 06940015 | -0.000354467 | 0.498741 | 19.0891 |
| 2 | 06940017 | 0.497362 | 0.00102502 | 19.0897 | 06940014 | 0.000865882 | 0.497521 | 19.0622 |
| 3 | 06940013 | 0.498380 | 7.00355e-06 | 18.9881 | 06940011 | 0.00000 | 0.498387 | 19.0101 |