| Red | Green | Blue | |
| z | 17.64 | ||
| znorm | Inf | ||
| sky | -Inf | -Inf | -Inf |
| S/N | 18.0 | 31.6 | 35.7 |
| S/N(c) | 0.0 | 0.0 | 0.0 |
| SN(E/C) |
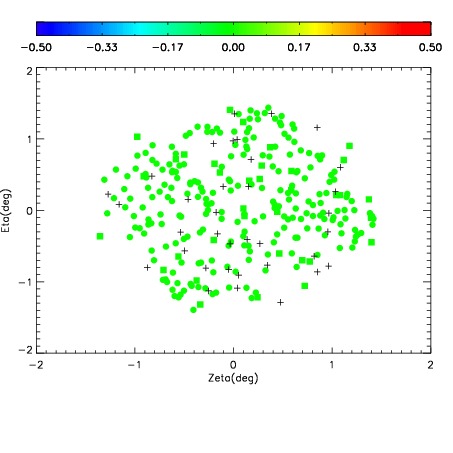


| Frame | Nreads | Zeropoints | Mag plots | Spatial mag deviation | Spatial sky 16325A emission deviations (filled: sky, open: star) | Spatial sky continuum emission | Spatial sky telluric CO2 absorption deviations (filled: H < 10) | |||||||||||||||||||||||
| 0 | 0 |
|
|
|
|
|
|
| IPAIR | NAME | SHIFT | NEWSHIFT | S/N | NAME | SHIFT | NEWSHIFT | S/N |
| 0 | 08030013 | 0.523601 | 0.00000 | 18.8889 | 08030014 | -0.00291232 | 0.526513 | 18.9403 |
| 1 | 08030012 | 0.523302 | 0.000298977 | 18.9515 | 08030011 | 0.00000 | 0.523601 | 18.9761 |
| 2 | 08030016 | 0.519114 | 0.00448698 | 18.8279 | 08030015 | -0.00399325 | 0.527594 | 18.8976 |