| Red | Green | Blue | |
| z | 17.64 | ||
| znorm | Inf | ||
| sky | -Inf | -Inf | -Inf |
| S/N | 21.2 | 35.9 | 41.2 |
| S/N(c) | 0.0 | 0.0 | 0.0 |
| SN(E/C) |
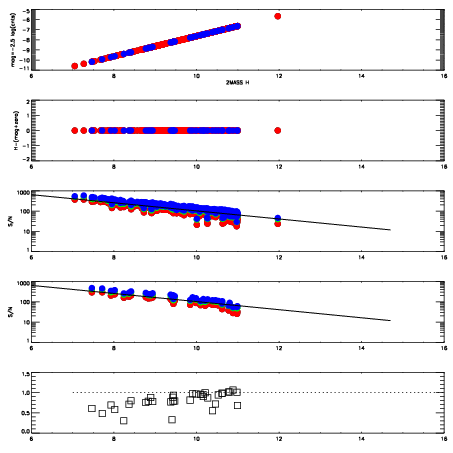
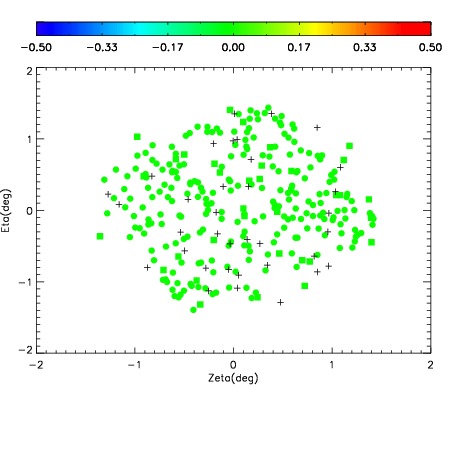
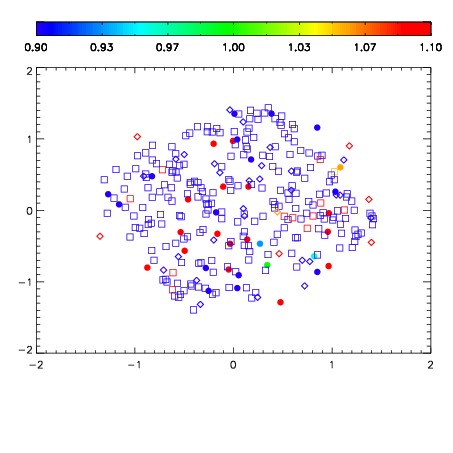
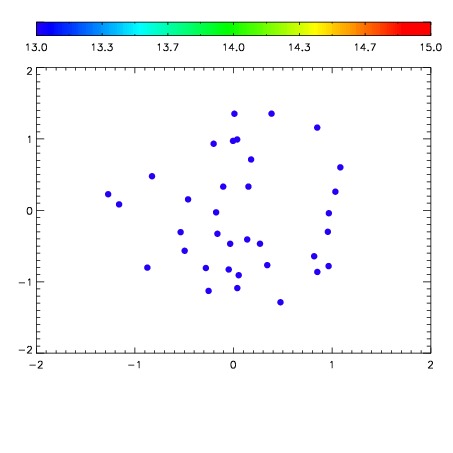

| Frame | Nreads | Zeropoints | Mag plots | Spatial mag deviation | Spatial sky 16325A emission deviations (filled: sky, open: star) | Spatial sky continuum emission | Spatial sky telluric CO2 absorption deviations (filled: H < 10) | |||||||||||||||||||||||
| 0 | 0 |
|
|
|
|
|
|
| IPAIR | NAME | SHIFT | NEWSHIFT | S/N | NAME | SHIFT | NEWSHIFT | S/N |
| 0 | 08040148 | 0.510045 | 0.00000 | 19.0896 | 08040149 | -0.00343399 | 0.513479 | 19.1163 |
| 1 | 08040151 | 0.503624 | 0.00642097 | 19.1299 | 08040150 | -0.00510832 | 0.515153 | 19.1227 |
| 2 | 08040147 | 0.505788 | 0.00425696 | 19.0762 | 08040146 | 0.00000 | 0.510045 | 19.0470 |