| Red | Green | Blue | |
| z | 17.64 | ||
| znorm | Inf | ||
| sky | -NaN | -NaN | -NaN |
| S/N | 21.1 | 33.4 | 37.4 |
| S/N(c) | 0.0 | 0.0 | 0.0 |
| SN(E/C) |
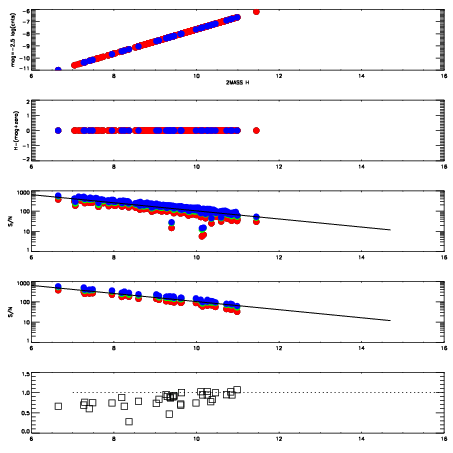

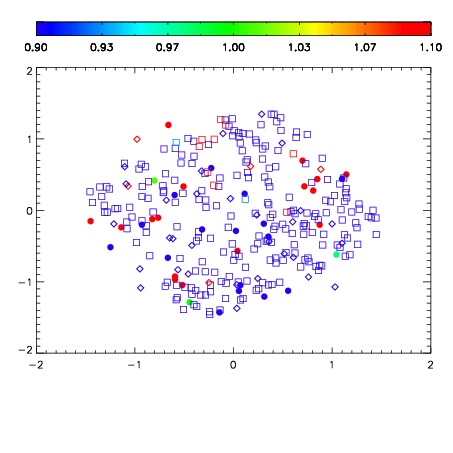


| Frame | Nreads | Zeropoints | Mag plots | Spatial mag deviation | Spatial sky 16325A emission deviations (filled: sky, open: star) | Spatial sky continuum emission | Spatial sky telluric CO2 absorption deviations (filled: H < 10) | |||||||||||||||||||||||
| 0 | 0 |
|
|
|
|
|
|
| IPAIR | NAME | SHIFT | NEWSHIFT | S/N | NAME | SHIFT | NEWSHIFT | S/N |
| 0 | 08060015 | 0.509849 | 0.00000 | 18.9022 | 08060017 | -0.00548271 | 0.515332 | 18.9411 |
| 1 | 08060014 | 0.504270 | 0.00557899 | 18.9493 | 08060016 | -0.00457661 | 0.514426 | 18.9623 |
| 2 | 08060018 | 0.508182 | 0.00166702 | 18.8543 | 08060013 | 0.00000 | 0.509849 | 18.8329 |