| Red | Green | Blue | |
| z | 17.64 | ||
| znorm | Inf | ||
| sky | -Inf | -Inf | -Inf |
| S/N | 29.6 | 46.9 | 51.3 |
| S/N(c) | 0.0 | 0.0 | 0.0 |
| SN(E/C) |

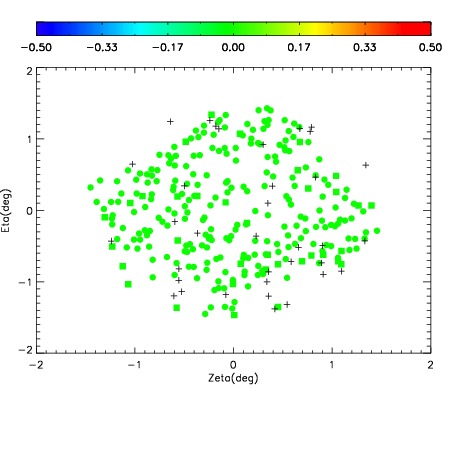
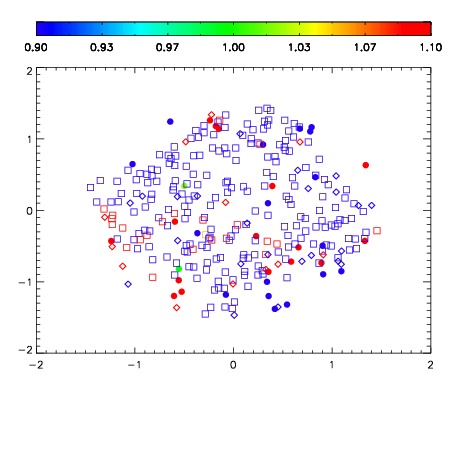


| Frame | Nreads | Zeropoints | Mag plots | Spatial mag deviation | Spatial sky 16325A emission deviations (filled: sky, open: star) | Spatial sky continuum emission | Spatial sky telluric CO2 absorption deviations (filled: H < 10) | |||||||||||||||||||||||
| 0 | 0 |
|
|
|
|
|
|
| IPAIR | NAME | SHIFT | NEWSHIFT | S/N | NAME | SHIFT | NEWSHIFT | S/N |
| 0 | 08760053 | 0.468416 | 0.00000 | 18.3931 | 08760048 | 0.00000 | 0.468416 | 18.4899 |
| 1 | 08760049 | 0.465322 | 0.00309402 | 18.5595 | 08760055 | -0.00236682 | 0.470783 | 18.6118 |
| 2 | 08760057 | 0.465417 | 0.00299901 | 18.5269 | 08760051 | -0.00126881 | 0.469685 | 18.5574 |
| 3 | 08760054 | 0.468245 | 0.000171006 | 18.4969 | 08760052 | 0.000249482 | 0.468167 | 18.5480 |
| 4 | 08760058 | 0.466921 | 0.00149500 | 18.4702 | 08760059 | -0.00137913 | 0.469795 | 18.5231 |
| 5 | 08760050 | 0.466755 | 0.00166100 | 18.4701 | 08760056 | -0.00172434 | 0.470140 | 18.5001 |