| Frame | Nreads | Zeropoints | Mag plots
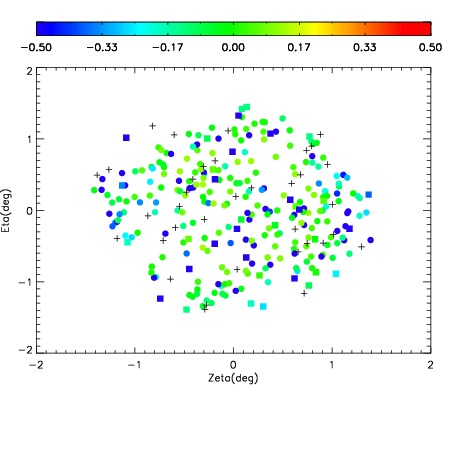
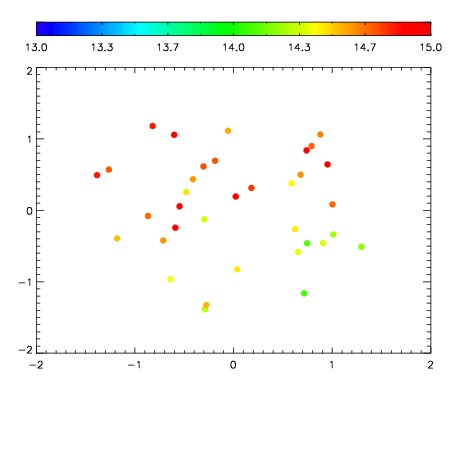
| Spatial mag deviation
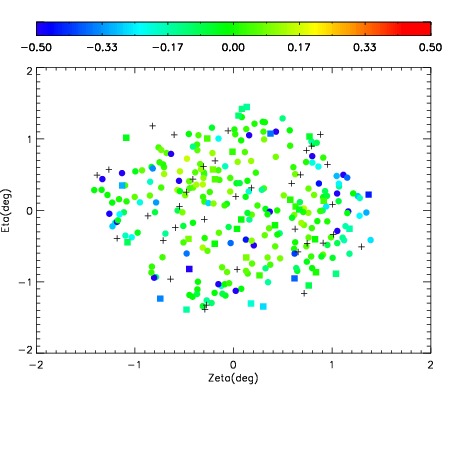
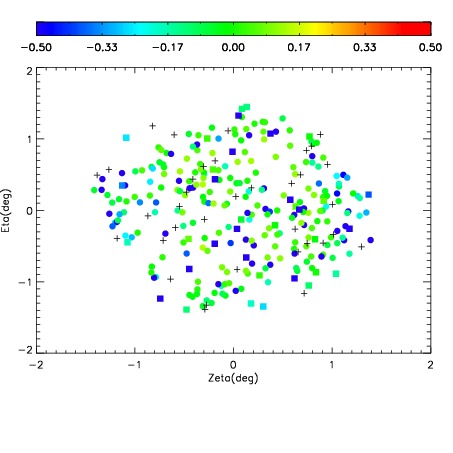
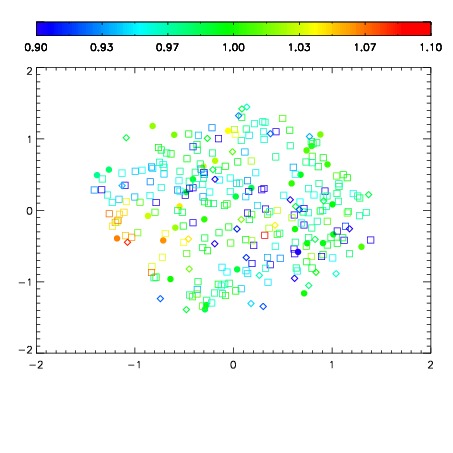
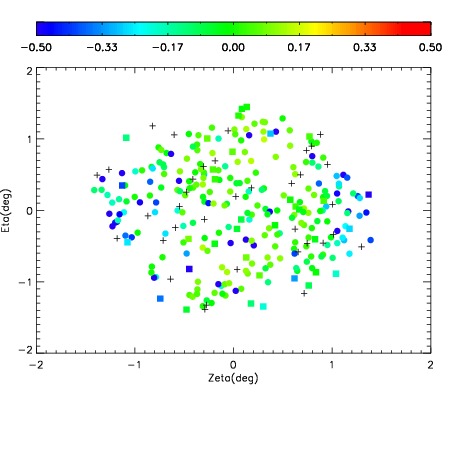
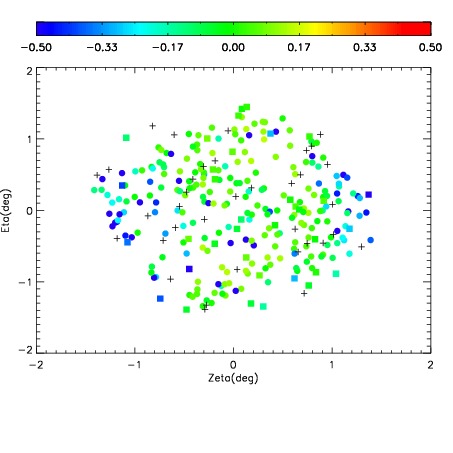
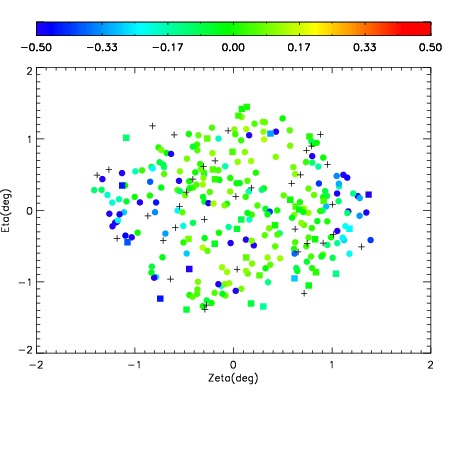
| Spatial sky 16325A emission deviations (filled: sky, open: star)
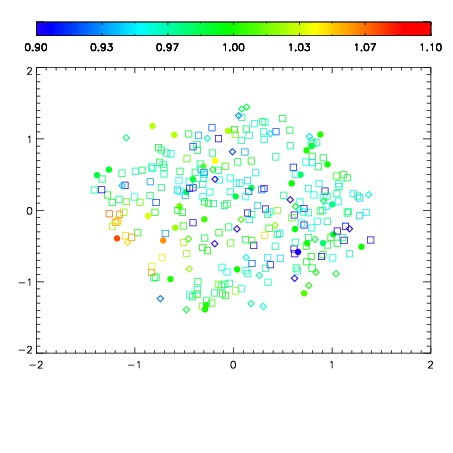
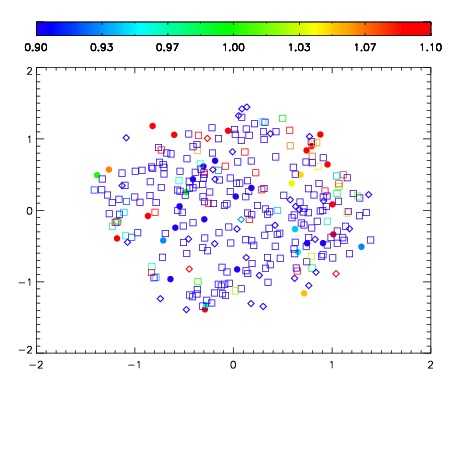
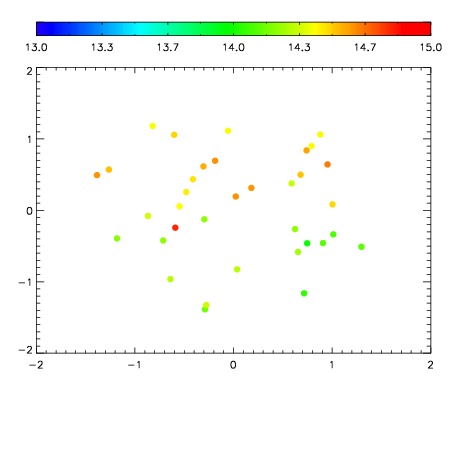
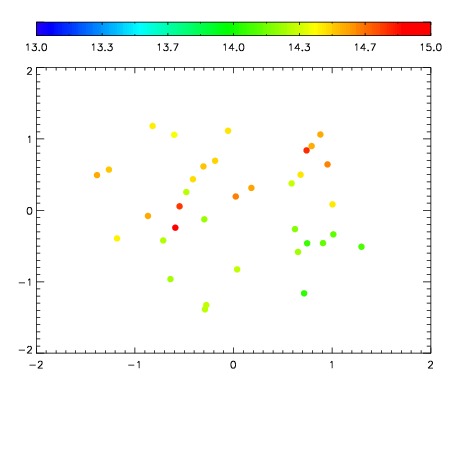
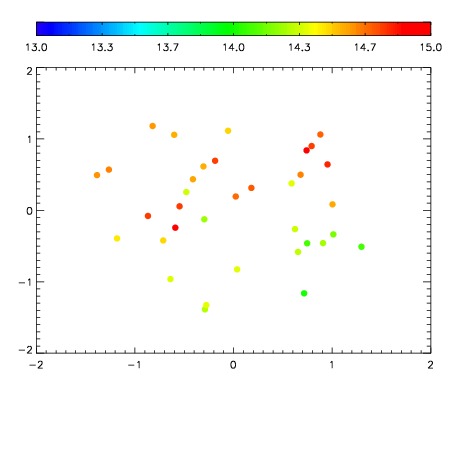
| Spatial sky continuum emission
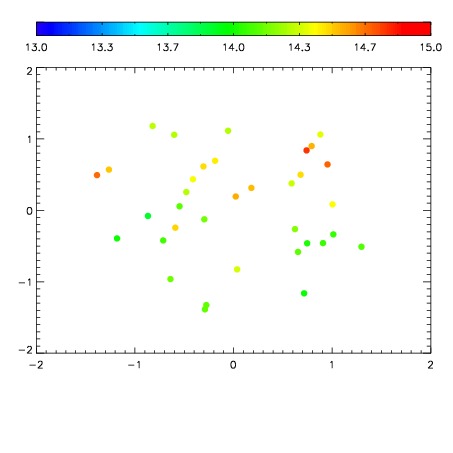
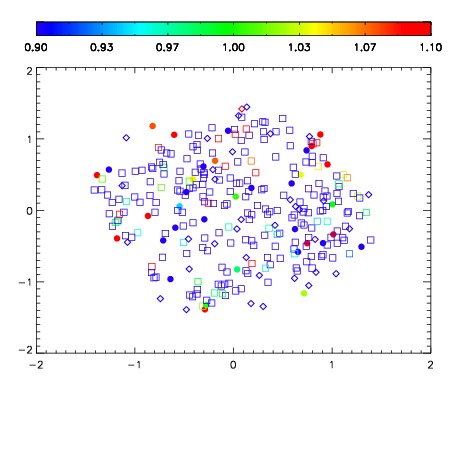
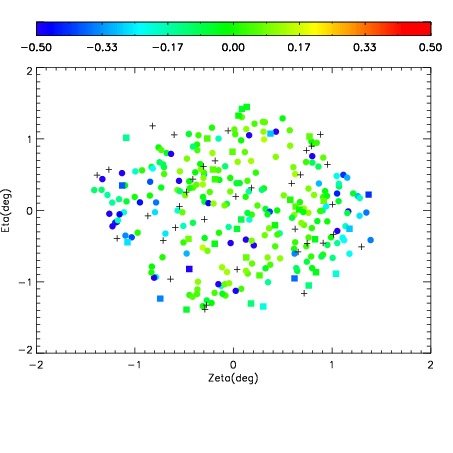
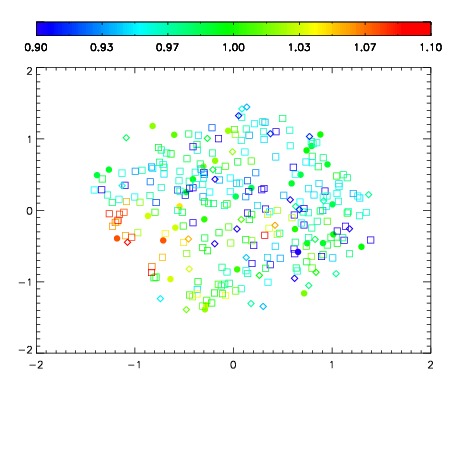
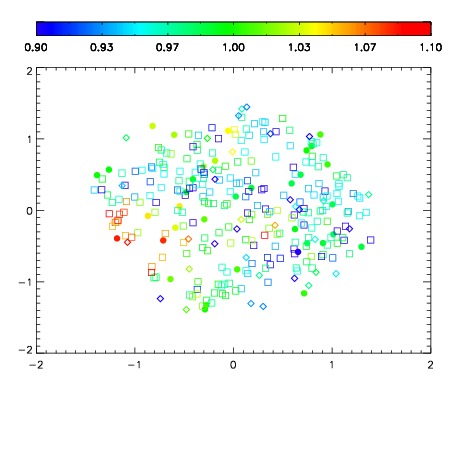
| Spatial sky telluric CO2 absorption deviations (filled: H < 10)
|
| 8760074
| 47
| | Red | Green | Blue
| | z | | 18.64
| | znorm | | 14.46
| | sky | 14.6 | 14.3 | 14.6
| | S/N | 10.8 | 16.5 | 16.3
| | S/N(c) | 12.0 | 12.5 | 12.7
| | SN(E/C) 0.93
|
| 
| 
| 
| 
| 
|
| 8760075
| 47
| | Red | Green | Blue
| | z | | 18.56
| | znorm | | 14.38
| | sky | 14.9 | 14.5 | 14.8
| | S/N | 9.8 | 15.7 | 15.6
| | S/N(c) | 10.9 | 10.7 | 11.0
| | SN(E/C) 1.14
|
| 
| 
| 
| 
| 
|
| 8760076
| 47
| | Red | Green | Blue
| | z | | 18.78
| | znorm | | 14.60
| | sky | 14.7 | 14.4 | 14.6
| | S/N | 11.3 | 17.6 | 17.8
| | S/N(c) | 12.5 | 12.2 | 12.8
| | SN(E/C) 1.06
|
| 
| 
| 
| 
| 
|
| 8760077
| 47
| | Red | Green | Blue
| | z | | 18.76
| | znorm | | 14.58
| | sky | 14.6 | 14.5 | 14.7
| | S/N | 11.0 | 17.0 | 17.5
| | S/N(c) | 12.5 | 13.2 | 13.6
| | SN(E/C) 0.91
|
| 
| 
| 
| 
| 
|
| 8760078
| 47
| | Red | Green | Blue
| | z | | 18.92
| | znorm | | 14.74
| | sky | 14.8 | 14.4 | 14.5
| | S/N | 11.8 | 18.1 | 18.7
| | S/N(c) | 13.6 | 14.2 | 14.7
| | SN(E/C) 0.92
|
| 
| 
| 
| 
| 
|
| 8760079
| 47
| | Red | Green | Blue
| | z | | 18.86
| | znorm | | 14.68
| | sky | 14.7 | 14.5 | 14.6
| | S/N | 11.4 | 17.6 | 18.3
| | S/N(c) | 13.2 | 13.9 | 14.2
| | SN(E/C) 0.92
|
| 
| 
| 
| 
| 
|
| 8760080
| 47
| | Red | Green | Blue
| | z | | 18.84
| | znorm | | 14.66
| | sky | 14.6 | 14.6 | 14.6
| | S/N | 11.0 | 17.2 | 18.1
| | S/N(c) | 13.1 | 13.8 | 14.0
| | SN(E/C) 0.91
|
| 
| 
| 
| 
| 
|
| 8760081
| 47
| | Red | Green | Blue
| | z | | 18.93
| | znorm | | 14.75
| | sky | 14.5 | 14.6 | 14.5
| | S/N | 11.8 | 18.2 | 19.1
| | S/N(c) | 13.8 | 14.4 | 14.7
| | SN(E/C) 0.90
|
| 
| 
| 
| 
| 
|
| 8760082
| 47
| | Red | Green | Blue
| | z | | 18.96
| | znorm | | 14.78
| | sky | 14.5 | 14.5 | 14.5
| | S/N | 11.6 | 18.1 | 19.0
| | S/N(c) | 14.1 | 14.7 | 15.0
| | SN(E/C) 0.90
|
| 
| 
| 
| 
| 
|
| 8760083
| 47
| | Red | Green | Blue
| | z | | 19.03
| | znorm | | 14.85
| | sky | 14.6 | 14.6 | 14.4
| | S/N | 12.1 | 18.6 | 19.6
| | S/N(c) | 14.6 | 15.2 | 15.6
| | SN(E/C) 0.91
|
| 
| 
| 
| 
| 
|