| Red | Green | Blue | |
| z | 17.64 | ||
| znorm | Inf | ||
| sky | -NaN | -Inf | -Inf |
| S/N | 22.4 | 34.7 | 37.5 |
| S/N(c) | 0.0 | 0.0 | 0.0 |
| SN(E/C) |
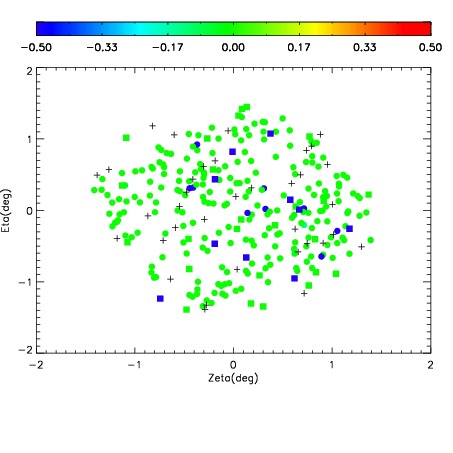
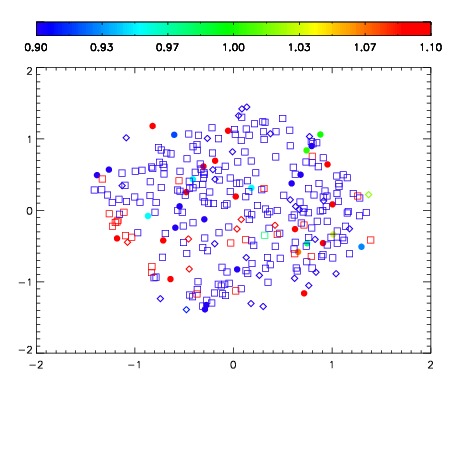
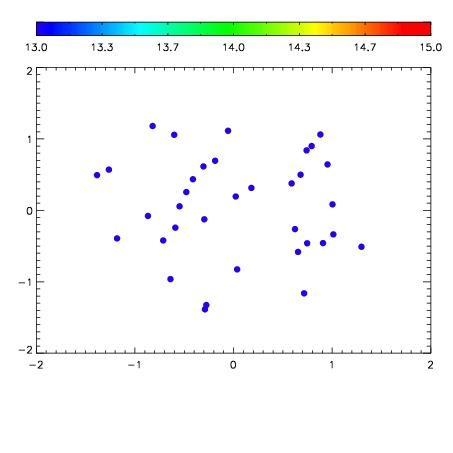

| Frame | Nreads | Zeropoints | Mag plots | Spatial mag deviation | Spatial sky 16325A emission deviations (filled: sky, open: star) | Spatial sky continuum emission | Spatial sky telluric CO2 absorption deviations (filled: H < 10) | |||||||||||||||||||||||
| 0 | 0 |
|
|
|
|
|
|
| IPAIR | NAME | SHIFT | NEWSHIFT | S/N | NAME | SHIFT | NEWSHIFT | S/N |
| 0 | 08760083 | 0.473398 | 0.00000 | 19.0235 | 08760082 | -0.00358276 | 0.476981 | 18.9536 |
| 1 | 08760079 | 0.472561 | 0.000836998 | 18.8449 | 08760081 | -0.00300787 | 0.476406 | 18.9112 |
| 2 | 08760080 | 0.471874 | 0.00152400 | 18.8192 | 08760078 | -0.000632017 | 0.474030 | 18.8950 |
| 3 | 08760076 | 0.402868 | 0.0705300 | 18.7720 | 08760077 | -0.000288941 | 0.473687 | 18.7443 |
| 4 | 08760075 | 0.370115 | 0.103283 | 18.5467 | 08760074 | 0.00000 | 0.473398 | 18.6273 |