| Red | Green | Blue | |
| z | 17.64 | ||
| znorm | Inf | ||
| sky | -Inf | -Inf | -Inf |
| S/N | 21.0 | 32.6 | 35.4 |
| S/N(c) | 0.0 | 0.0 | 0.0 |
| SN(E/C) |
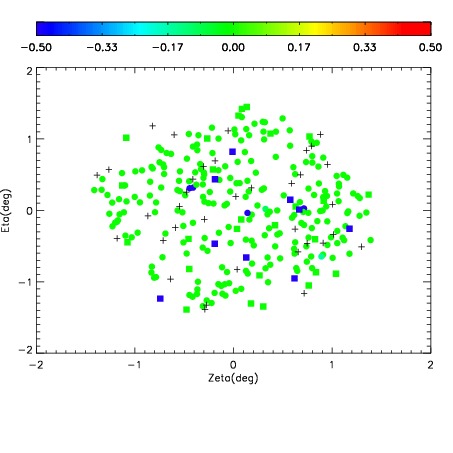
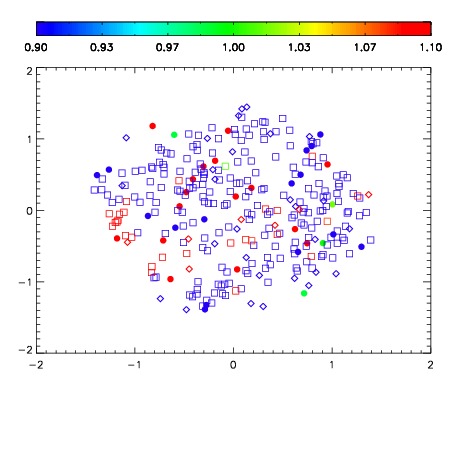
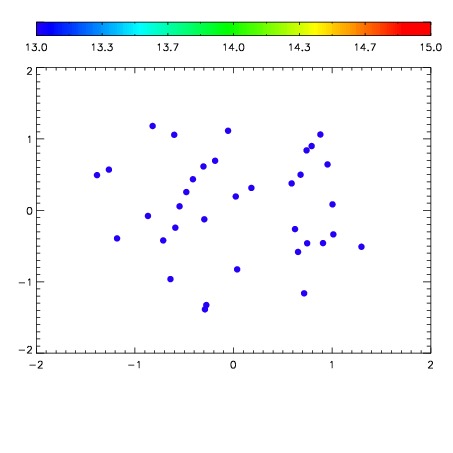

| Frame | Nreads | Zeropoints | Mag plots | Spatial mag deviation | Spatial sky 16325A emission deviations (filled: sky, open: star) | Spatial sky continuum emission | Spatial sky telluric CO2 absorption deviations (filled: H < 10) | |||||||||||||||||||||||
| 0 | 0 |
|
|
|
|
|
|
| IPAIR | NAME | SHIFT | NEWSHIFT | S/N | NAME | SHIFT | NEWSHIFT | S/N |
| 0 | 08770075 | 0.476671 | 0.00000 | 18.8430 | 08770076 | 0.00192833 | 0.474743 | 18.8987 |
| 1 | 08770070 | 0.474248 | 0.00242302 | 19.0398 | 08770069 | 0.00000 | 0.476671 | 19.0025 |
| 2 | 08770074 | 0.474750 | 0.00192100 | 18.9559 | 08770073 | 0.00142573 | 0.475245 | 18.9703 |
| 3 | 08770071 | 0.351092 | 0.125579 | 18.9515 | 08770072 | 0.00156959 | 0.475101 | 18.9605 |