| Red | Green | Blue | |
| z | 17.64 | ||
| znorm | Inf | ||
| sky | -NaN | -NaN | -Inf |
| S/N | 25.6 | 41.6 | 42.3 |
| S/N(c) | 0.0 | 0.0 | 0.0 |
| SN(E/C) |
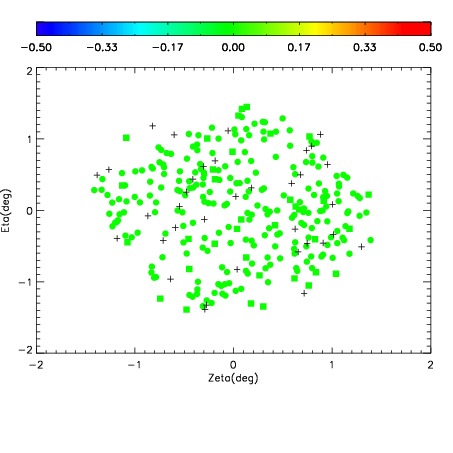
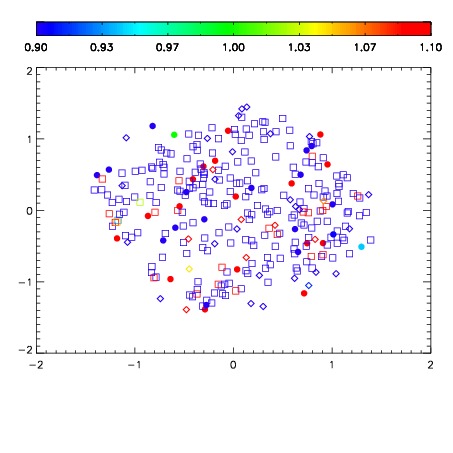
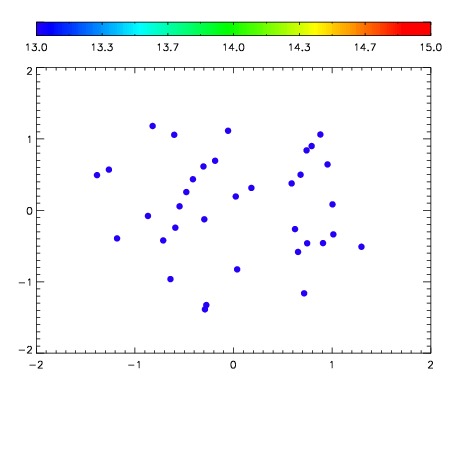

| Frame | Nreads | Zeropoints | Mag plots | Spatial mag deviation | Spatial sky 16325A emission deviations (filled: sky, open: star) | Spatial sky continuum emission | Spatial sky telluric CO2 absorption deviations (filled: H < 10) | |||||||||||||||||||||||
| 0 | 0 |
|
|
|
|
|
|
| IPAIR | NAME | SHIFT | NEWSHIFT | S/N | NAME | SHIFT | NEWSHIFT | S/N |
| 0 | 08800026 | 0.473130 | 0.00000 | 19.0053 | 08800027 | -0.00320383 | 0.476334 | 19.0001 |
| 1 | 08800030 | 0.470423 | 0.00270697 | 19.0230 | 08800031 | -0.00325190 | 0.476382 | 19.0621 |
| 2 | 08800029 | 0.470738 | 0.00239199 | 18.9858 | 08800028 | -0.00228192 | 0.475412 | 18.9688 |
| 3 | 08800025 | 0.471631 | 0.00149900 | 18.9460 | 08800024 | 0.00000 | 0.473130 | 18.8976 |