| Red | Green | Blue | |
| z | 17.64 | ||
| znorm | Inf | ||
| sky | -Inf | -Inf | -Inf |
| S/N | 29.8 | 50.9 | 57.8 |
| S/N(c) | 0.0 | 0.0 | 0.0 |
| SN(E/C) |
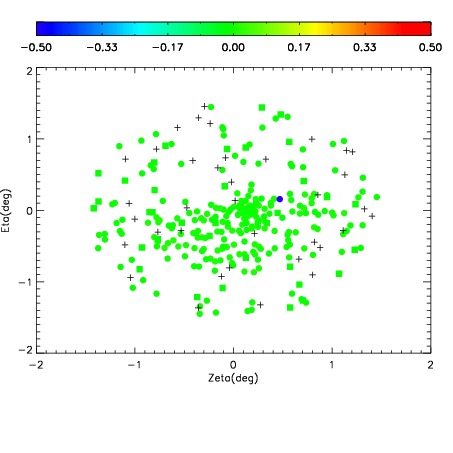
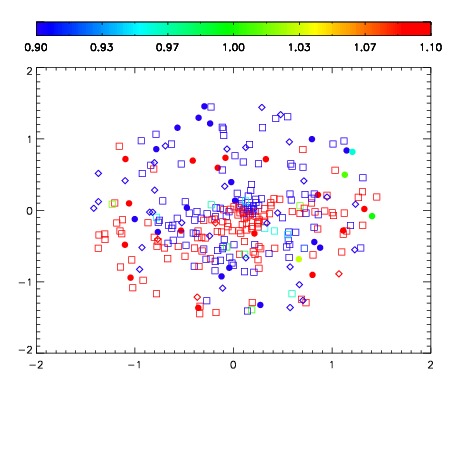
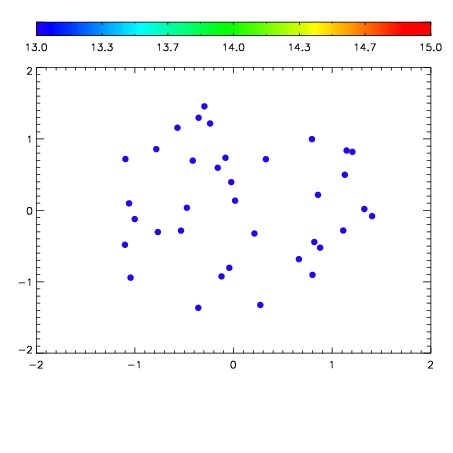

| Frame | Nreads | Zeropoints | Mag plots | Spatial mag deviation | Spatial sky 16325A emission deviations (filled: sky, open: star) | Spatial sky continuum emission | Spatial sky telluric CO2 absorption deviations (filled: H < 10) | |||||||||||||||||||||||
| 0 | 0 |
|
|
|
|
|
|
| IPAIR | NAME | SHIFT | NEWSHIFT | S/N | NAME | SHIFT | NEWSHIFT | S/N |
| 0 | 06100049 | 0.493565 | 0.00000 | 19.1689 | 06100050 | 0.00261371 | 0.490951 | 19.1691 |
| 1 | 06100048 | 0.492744 | 0.000820994 | 19.1582 | 06100047 | 0.00000 | 0.493565 | 19.1606 |
| 2 | 06100052 | 0.491280 | 0.00228500 | 19.1104 | 06100051 | 0.00158365 | 0.491981 | 19.1356 |
| 3 | 06100053 | 0.491870 | 0.00169501 | 19.0897 | 06100054 | 0.00332167 | 0.490243 | 19.1268 |