| Red | Green | Blue | |
| z | 17.64 | ||
| znorm | Inf | ||
| sky | -NaN | -NaN | -Inf |
| S/N | 25.0 | 44.6 | 48.5 |
| S/N(c) | 0.0 | 0.0 | 0.0 |
| SN(E/C) |
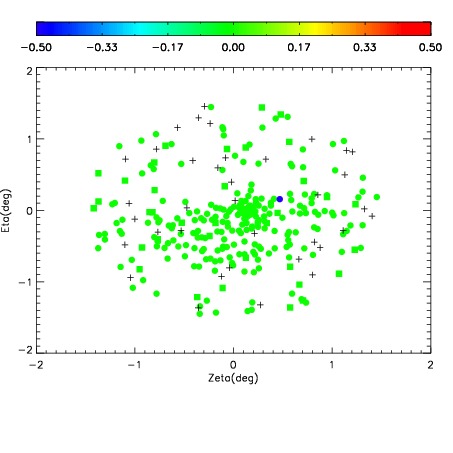
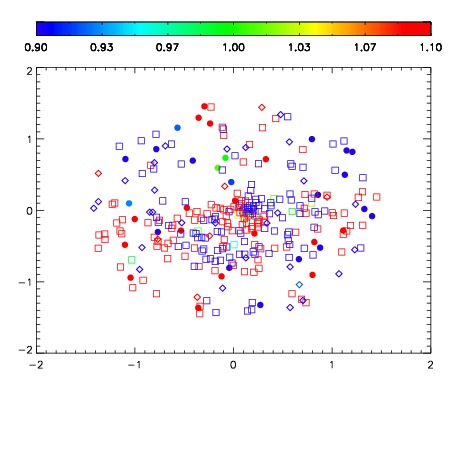


| Frame | Nreads | Zeropoints | Mag plots | Spatial mag deviation | Spatial sky 16325A emission deviations (filled: sky, open: star) | Spatial sky continuum emission | Spatial sky telluric CO2 absorption deviations (filled: H < 10) | |||||||||||||||||||||||
| 0 | 0 |
|
|
|
|
|
|
| IPAIR | NAME | SHIFT | NEWSHIFT | S/N | NAME | SHIFT | NEWSHIFT | S/N |
| 0 | 06320039 | 0.479403 | 0.00000 | 18.9901 | 06320040 | 0.00870795 | 0.470695 | 18.9240 |
| 1 | 06320038 | 0.478207 | 0.00119600 | 19.1503 | 06320037 | 0.00000 | 0.479403 | 19.0454 |
| 2 | 06320043 | 0.477275 | 0.00212798 | 18.8415 | 06320041 | 0.00344702 | 0.475956 | 18.8137 |
| 3 | 06320042 | 0.477180 | 0.00222299 | 18.7933 | 06320044 | 0.00523141 | 0.474172 | 18.7478 |