| Red | Green | Blue | |
| z | 17.64 | ||
| znorm | Inf | ||
| sky | -Inf | -Inf | -Inf |
| S/N | 22.2 | 40.5 | 42.6 |
| S/N(c) | 0.0 | 0.0 | 0.0 |
| SN(E/C) |
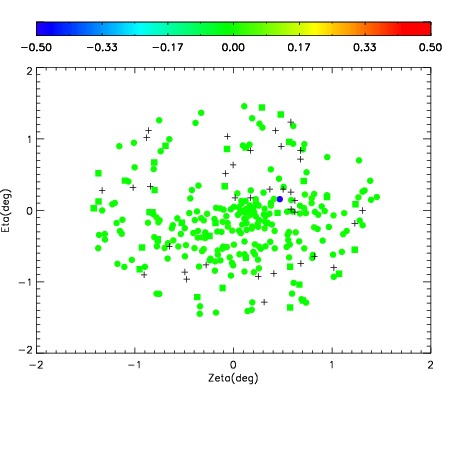
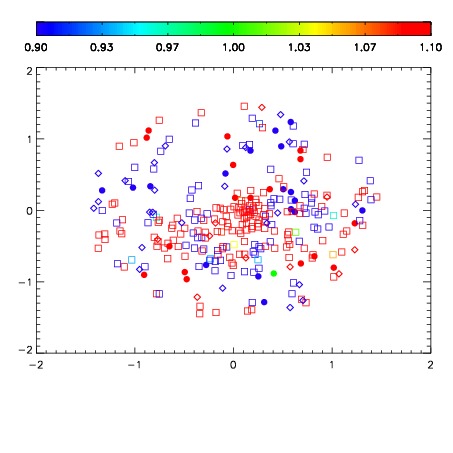


| Frame | Nreads | Zeropoints | Mag plots | Spatial mag deviation | Spatial sky 16325A emission deviations (filled: sky, open: star) | Spatial sky continuum emission | Spatial sky telluric CO2 absorption deviations (filled: H < 10) | |||||||||||||||||||||||
| 0 | 0 |
|
|
|
|
|
|
| IPAIR | NAME | SHIFT | NEWSHIFT | S/N | NAME | SHIFT | NEWSHIFT | S/N |
| 0 | 06070049 | 0.477916 | 0.00000 | 18.8360 | 06070050 | 0.00152728 | 0.476389 | 18.8260 |
| 1 | 06070053 | 0.477298 | 0.000618011 | 18.9947 | 06070054 | -0.000724857 | 0.478641 | 19.0431 |
| 2 | 06070052 | 0.476964 | 0.000952005 | 18.9405 | 06070051 | -5.58946e-05 | 0.477972 | 18.8501 |
| 3 | 06070048 | 0.477556 | 0.000360012 | 18.7759 | 06070047 | 0.00000 | 0.477916 | 18.7876 |