| Red | Green | Blue | |
| z | 17.64 | ||
| znorm | Inf | ||
| sky | -Inf | -NaN | -Inf |
| S/N | 27.0 | 47.3 | 52.3 |
| S/N(c) | 0.0 | 0.0 | 0.0 |
| SN(E/C) |
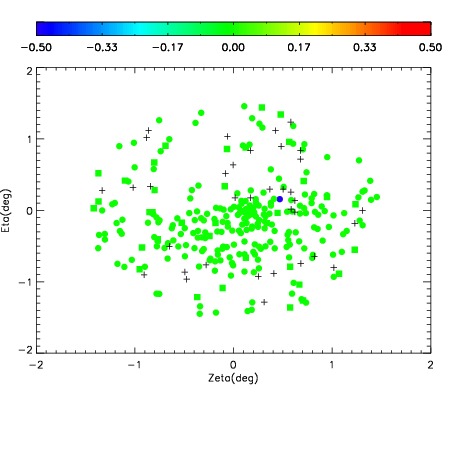
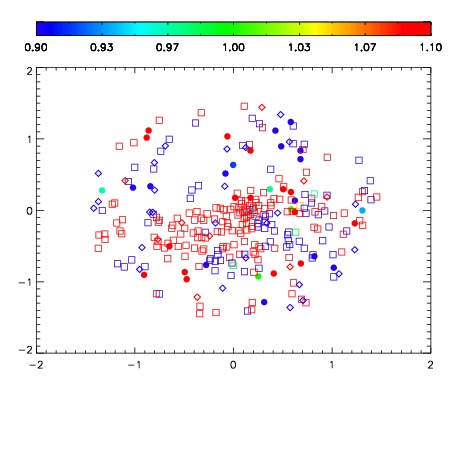


| Frame | Nreads | Zeropoints | Mag plots | Spatial mag deviation | Spatial sky 16325A emission deviations (filled: sky, open: star) | Spatial sky continuum emission | Spatial sky telluric CO2 absorption deviations (filled: H < 10) | |||||||||||||||||||||||
| 0 | 0 |
|
|
|
|
|
|
| IPAIR | NAME | SHIFT | NEWSHIFT | S/N | NAME | SHIFT | NEWSHIFT | S/N |
| 0 | 06110053 | 0.485918 | 0.00000 | 19.2391 | 06110054 | 0.000341960 | 0.485576 | 19.2371 |
| 1 | 06110052 | 0.485082 | 0.000835985 | 19.2377 | 06110050 | 0.000922267 | 0.484996 | 19.2321 |
| 2 | 06110049 | 0.485469 | 0.000448972 | 19.1790 | 06110051 | -0.000477135 | 0.486395 | 19.2316 |
| 3 | 06110048 | 0.485279 | 0.000638992 | 19.1380 | 06110047 | 0.00000 | 0.485918 | 19.1363 |