| Red | Green | Blue | |
| z | 17.64 | ||
| znorm | Inf | ||
| sky | -Inf | -Inf | -Inf |
| S/N | 25.7 | 46.6 | 48.9 |
| S/N(c) | 0.0 | 0.0 | 0.0 |
| SN(E/C) |
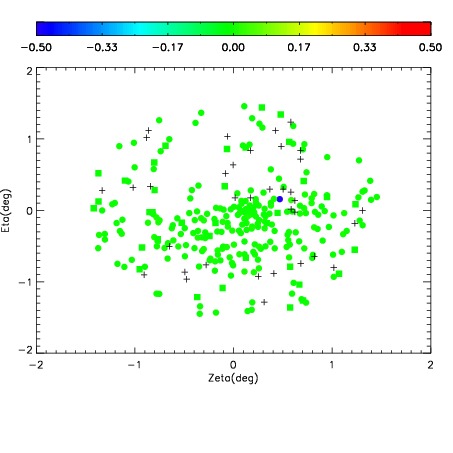
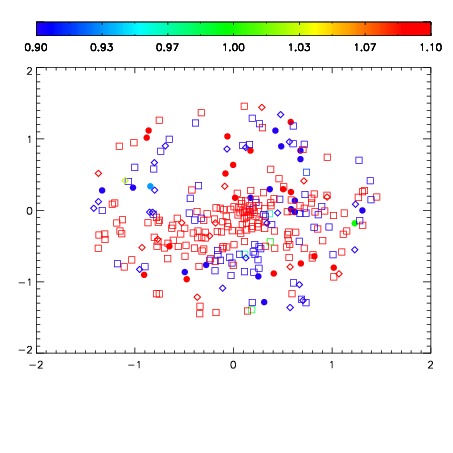
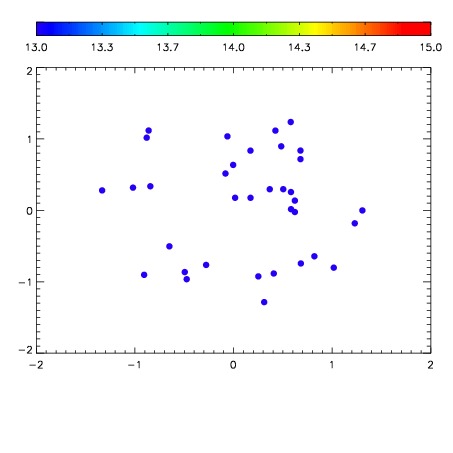

| Frame | Nreads | Zeropoints | Mag plots | Spatial mag deviation | Spatial sky 16325A emission deviations (filled: sky, open: star) | Spatial sky continuum emission | Spatial sky telluric CO2 absorption deviations (filled: H < 10) | |||||||||||||||||||||||
| 0 | 0 |
|
|
|
|
|
|
| IPAIR | NAME | SHIFT | NEWSHIFT | S/N | NAME | SHIFT | NEWSHIFT | S/N |
| 0 | 06330041 | 0.478578 | 0.00000 | 19.1539 | 06330039 | 0.00818649 | 0.470392 | 19.1722 |
| 1 | 06330040 | 0.477969 | 0.000609010 | 19.1586 | 06330042 | 0.000903230 | 0.477675 | 19.1818 |
| 2 | 06330036 | 0.473381 | 0.00519699 | 19.1405 | 06330038 | 0.00509710 | 0.473481 | 19.1421 |
| 3 | 06330037 | 0.473262 | 0.00531599 | 19.0549 | 06330035 | 0.00000 | 0.478578 | 19.1044 |