| Red | Green | Blue | |
| z | 17.64 | ||
| znorm | Inf | ||
| sky | -NaN | -Inf | -NaN |
| S/N | 27.7 | 45.6 | 48.5 |
| S/N(c) | 0.0 | 0.0 | 0.0 |
| SN(E/C) |
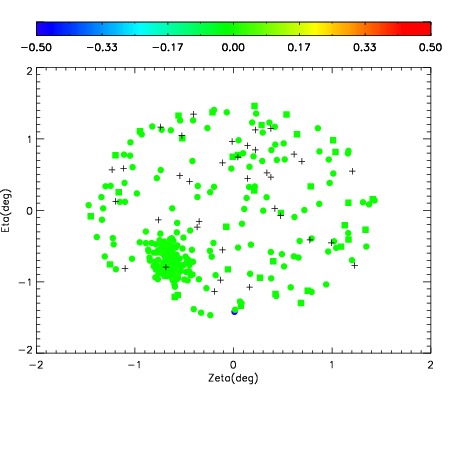
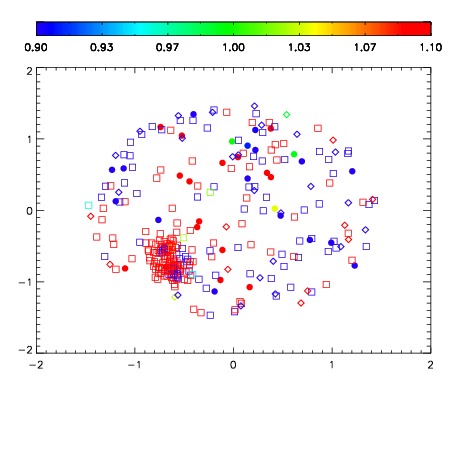
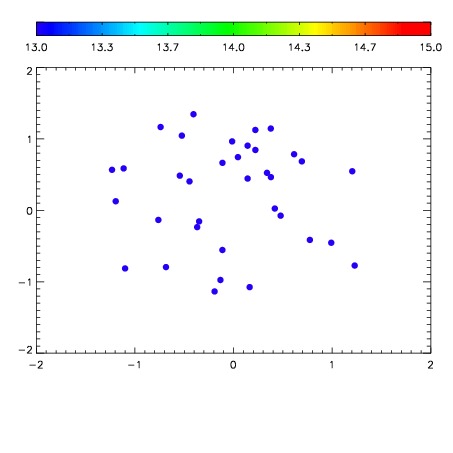

| Frame | Nreads | Zeropoints | Mag plots | Spatial mag deviation | Spatial sky 16325A emission deviations (filled: sky, open: star) | Spatial sky continuum emission | Spatial sky telluric CO2 absorption deviations (filled: H < 10) | |||||||||||||||||||||||
| 0 | 0 |
|
|
|
|
|
|
| IPAIR | NAME | SHIFT | NEWSHIFT | S/N | NAME | SHIFT | NEWSHIFT | S/N |
| 0 | 06750023 | 0.492560 | 0.00000 | 19.1214 | 06750028 | 0.00221328 | 0.490347 | 19.1198 |
| 1 | 06750026 | 0.491767 | 0.000793010 | 19.1129 | 06750024 | -0.000185742 | 0.492746 | 19.1031 |
| 2 | 06750022 | 0.492022 | 0.000537992 | 19.0983 | 06750025 | -0.00138013 | 0.493940 | 19.1028 |
| 3 | 06750027 | 0.492150 | 0.000409991 | 19.0948 | 06750021 | 0.00000 | 0.492560 | 19.0793 |