| Red | Green | Blue | |
| z | 17.64 | ||
| znorm | Inf | ||
| sky | -Inf | -Inf | -Inf |
| S/N | 28.0 | 47.7 | 49.3 |
| S/N(c) | 0.0 | 0.0 | 0.0 |
| SN(E/C) |
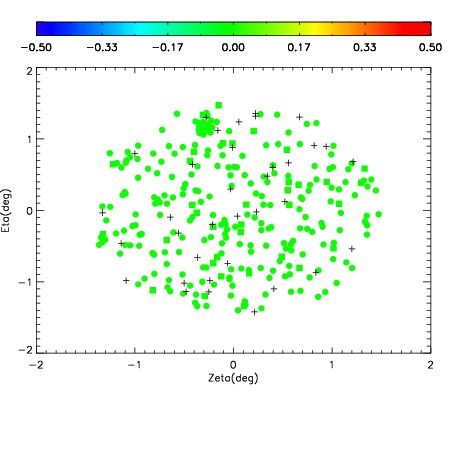
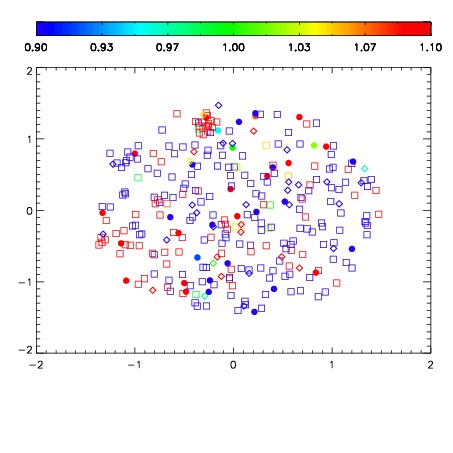
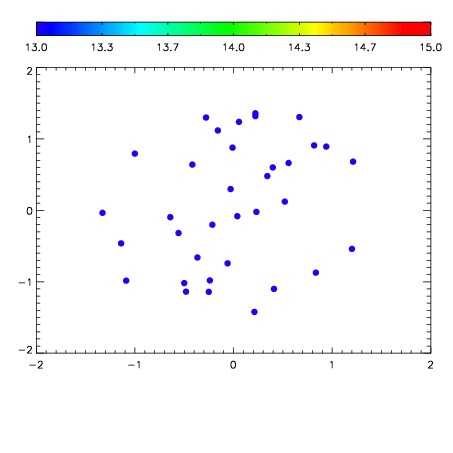

| Frame | Nreads | Zeropoints | Mag plots | Spatial mag deviation | Spatial sky 16325A emission deviations (filled: sky, open: star) | Spatial sky continuum emission | Spatial sky telluric CO2 absorption deviations (filled: H < 10) | |||||||||||||||||||||||
| 0 | 0 |
|
|
|
|
|
|
| IPAIR | NAME | SHIFT | NEWSHIFT | S/N | NAME | SHIFT | NEWSHIFT | S/N |
| 0 | 06660042 | 0.487122 | 0.00000 | 19.0223 | 06660039 | -0.00214378 | 0.489266 | 19.0396 |
| 1 | 06660041 | 0.485824 | 0.00129801 | 19.0422 | 06660043 | 0.00210275 | 0.485019 | 19.0849 |
| 2 | 06660037 | 0.485701 | 0.00142100 | 19.0291 | 06660040 | -0.00189097 | 0.489013 | 19.0574 |
| 3 | 06660038 | 0.485770 | 0.00135201 | 19.0183 | 06660036 | 0.00000 | 0.487122 | 19.0157 |