| Red | Green | Blue | |
| z | 17.64 | ||
| znorm | Inf | ||
| sky | -Inf | -Inf | -Inf |
| S/N | 24.1 | 40.9 | 40.7 |
| S/N(c) | 0.0 | 0.0 | 0.0 |
| SN(E/C) |
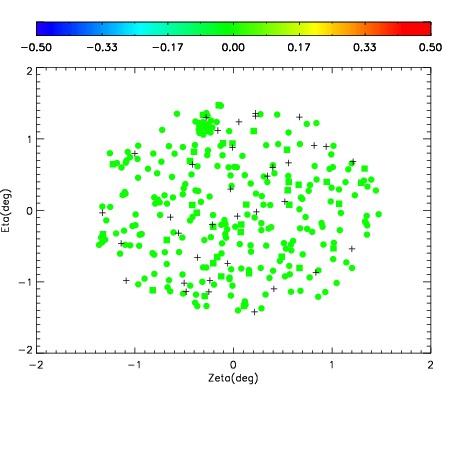
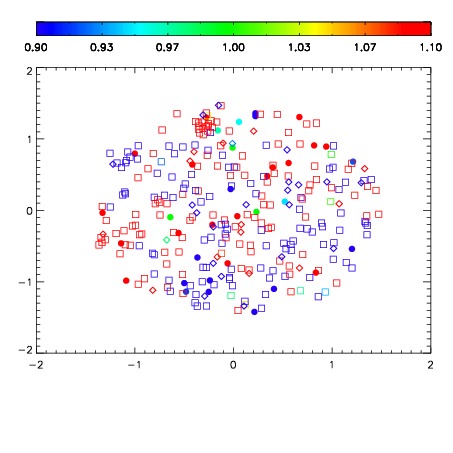
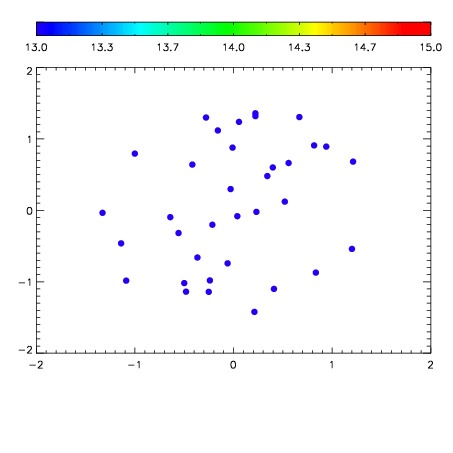

| Frame | Nreads | Zeropoints | Mag plots | Spatial mag deviation | Spatial sky 16325A emission deviations (filled: sky, open: star) | Spatial sky continuum emission | Spatial sky telluric CO2 absorption deviations (filled: H < 10) | |||||||||||||||||||||||
| 0 | 0 |
|
|
|
|
|
|
| IPAIR | NAME | SHIFT | NEWSHIFT | S/N | NAME | SHIFT | NEWSHIFT | S/N |
| 0 | 06890032 | 0.494432 | 0.00000 | 18.7692 | 06890033 | 0.00321490 | 0.491217 | 18.7045 |
| 1 | 06890027 | 0.493122 | 0.00130999 | 18.9727 | 06890030 | -0.00330527 | 0.497737 | 18.9562 |
| 2 | 06890028 | 0.494218 | 0.000214010 | 18.9292 | 06890029 | 0.000563682 | 0.493868 | 18.9455 |
| 3 | 06890031 | 0.494176 | 0.000256002 | 18.8216 | 06890026 | 0.00000 | 0.494432 | 18.8574 |