| Red | Green | Blue | |
| z | 17.64 | ||
| znorm | Inf | ||
| sky | -Inf | -Inf | -Inf |
| S/N | 32.1 | 52.4 | 54.2 |
| S/N(c) | 0.0 | 0.0 | 0.0 |
| SN(E/C) |
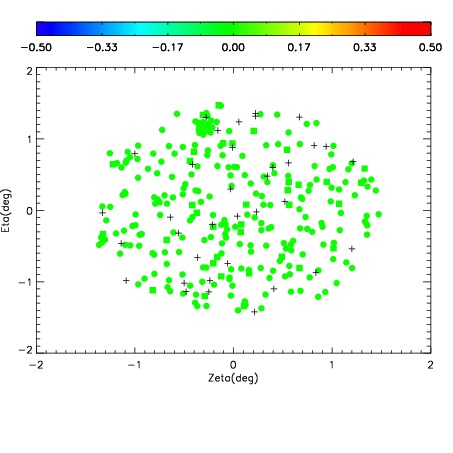
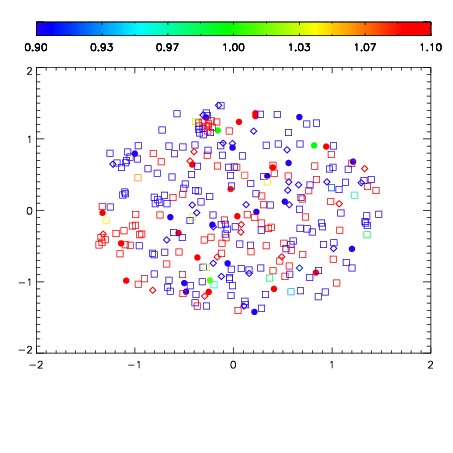


| Frame | Nreads | Zeropoints | Mag plots | Spatial mag deviation | Spatial sky 16325A emission deviations (filled: sky, open: star) | Spatial sky continuum emission | Spatial sky telluric CO2 absorption deviations (filled: H < 10) | |||||||||||||||||||||||
| 0 | 0 |
|
|
|
|
|
|
| IPAIR | NAME | SHIFT | NEWSHIFT | S/N | NAME | SHIFT | NEWSHIFT | S/N |
| 0 | 06930012 | 0.498211 | 0.00000 | 19.0239 | 06930013 | 0.00101867 | 0.497192 | 19.0475 |
| 1 | 06930019 | 0.492373 | 0.00583801 | 19.1862 | 06930018 | 0.000202101 | 0.498009 | 19.1666 |
| 2 | 06930015 | 0.494849 | 0.00336200 | 19.1180 | 06930017 | 0.00121370 | 0.496997 | 19.1365 |
| 3 | 06930016 | 0.495039 | 0.00317201 | 19.0776 | 06930010 | 0.00000 | 0.498211 | 19.1035 |
| 4 | 06930011 | 0.498024 | 0.000187010 | 19.0731 | 06930014 | -0.00111865 | 0.499330 | 19.0928 |