| Red | Green | Blue | |
| z | 17.64 | ||
| znorm | Inf | ||
| sky | -NaN | -NaN | -Inf |
| S/N | 22.7 | 37.6 | 39.0 |
| S/N(c) | 0.0 | 0.0 | 0.0 |
| SN(E/C) |
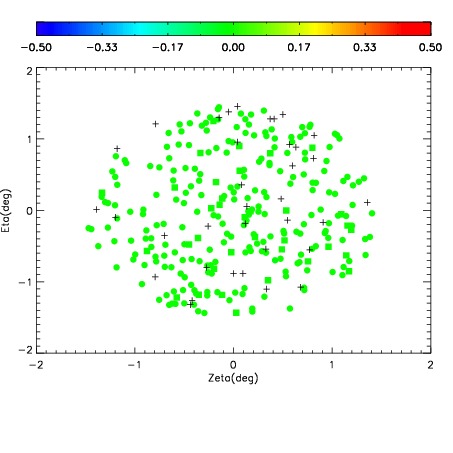
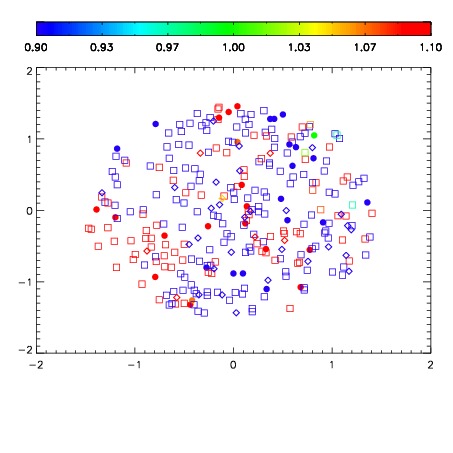
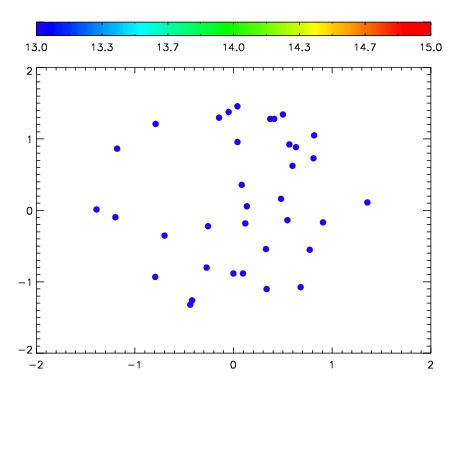

| Frame | Nreads | Zeropoints | Mag plots | Spatial mag deviation | Spatial sky 16325A emission deviations (filled: sky, open: star) | Spatial sky continuum emission | Spatial sky telluric CO2 absorption deviations (filled: H < 10) | |||||||||||||||||||||||
| 0 | 0 |
|
|
|
|
|
|
| IPAIR | NAME | SHIFT | NEWSHIFT | S/N | NAME | SHIFT | NEWSHIFT | S/N |
| 0 | 06320053 | 0.473016 | 0.00000 | 18.8344 | 06320055 | -0.00192008 | 0.474936 | 18.7474 |
| 1 | 06320054 | 0.472979 | 3.69847e-05 | 18.7899 | 06320051 | 0.00144201 | 0.471574 | 18.7314 |
| 2 | 06320049 | 0.471476 | 0.00154001 | 18.7678 | 06320052 | -0.000539059 | 0.473555 | 18.6725 |
| 3 | 06320050 | 0.472225 | 0.000790983 | 18.7361 | 06320048 | 0.00000 | 0.473016 | 18.3921 |