| Red | Green | Blue | |
| z | 17.64 | ||
| znorm | Inf | ||
| sky | -Inf | -Inf | -Inf |
| S/N | 29.5 | 46.1 | 49.4 |
| S/N(c) | 0.0 | 0.0 | 0.0 |
| SN(E/C) |
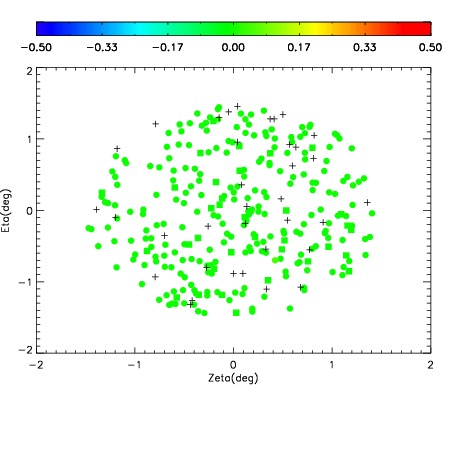
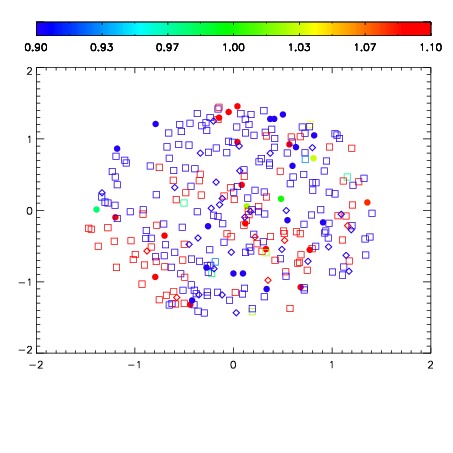


| Frame | Nreads | Zeropoints | Mag plots | Spatial mag deviation | Spatial sky 16325A emission deviations (filled: sky, open: star) | Spatial sky continuum emission | Spatial sky telluric CO2 absorption deviations (filled: H < 10) | |||||||||||||||||||||||
| 0 | 0 |
|
|
|
|
|
|
| IPAIR | NAME | SHIFT | NEWSHIFT | S/N | NAME | SHIFT | NEWSHIFT | S/N |
| 0 | 06640038 | 0.488775 | 0.00000 | 19.0882 | 06640039 | 0.00483695 | 0.483938 | 19.0462 |
| 1 | 06640042 | 0.486941 | 0.00183401 | 19.1067 | 06640036 | 0.00000 | 0.488775 | 19.0781 |
| 2 | 06640037 | 0.487747 | 0.00102800 | 19.0718 | 06640043 | 0.00478870 | 0.483986 | 19.0375 |
| 3 | 06640041 | 0.487585 | 0.00119001 | 18.9995 | 06640040 | 0.00296683 | 0.485808 | 19.0296 |