| Red | Green | Blue | |
| z | 17.64 | ||
| znorm | Inf | ||
| sky | -NaN | -NaN | -Inf |
| S/N | 30.8 | 47.5 | 51.1 |
| S/N(c) | 0.0 | 0.0 | 0.0 |
| SN(E/C) |
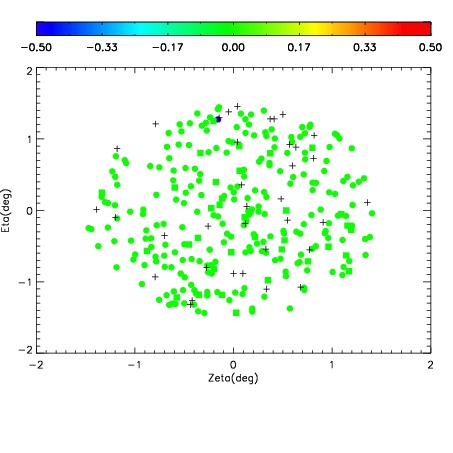
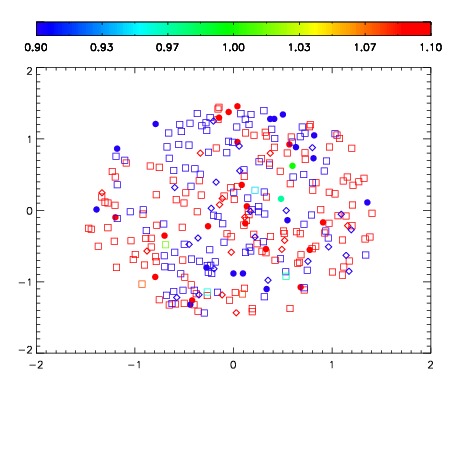


| Frame | Nreads | Zeropoints | Mag plots | Spatial mag deviation | Spatial sky 16325A emission deviations (filled: sky, open: star) | Spatial sky continuum emission | Spatial sky telluric CO2 absorption deviations (filled: H < 10) | |||||||||||||||||||||||
| 0 | 0 |
|
|
|
|
|
|
| IPAIR | NAME | SHIFT | NEWSHIFT | S/N | NAME | SHIFT | NEWSHIFT | S/N |
| 0 | 06920017 | 0.496430 | 0.00000 | 19.1468 | 06920015 | -0.000539218 | 0.496969 | 19.1416 |
| 1 | 06920016 | 0.495710 | 0.000720024 | 19.1666 | 06920018 | 0.00163575 | 0.494794 | 19.1655 |
| 2 | 06920013 | 0.495379 | 0.00105101 | 19.1563 | 06920014 | 0.00269306 | 0.493737 | 19.1532 |
| 3 | 06920012 | 0.494589 | 0.00184101 | 19.0946 | 06920011 | 0.00000 | 0.496430 | 19.0617 |