| Red | Green | Blue | |
| z | 17.64 | ||
| znorm | Inf | ||
| sky | -NaN | -Inf | -NaN |
| S/N | 22.0 | 38.8 | 39.2 |
| S/N(c) | 0.0 | 0.0 | 0.0 |
| SN(E/C) |
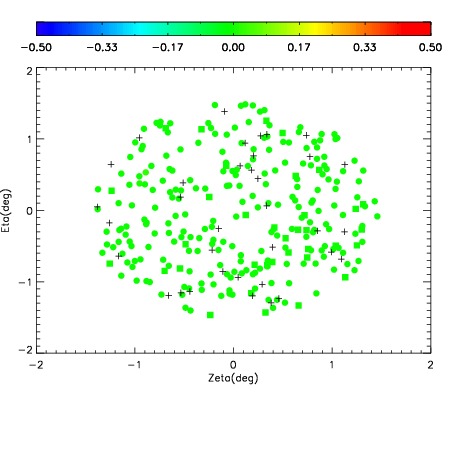
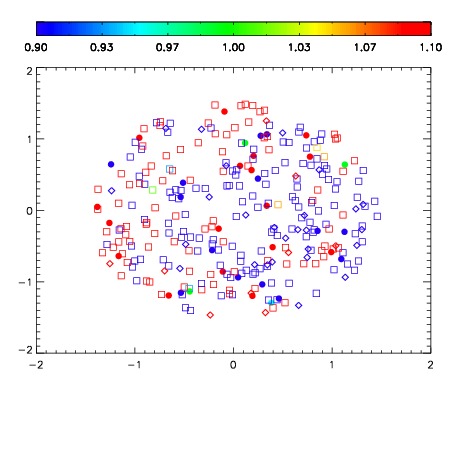


| Frame | Nreads | Zeropoints | Mag plots | Spatial mag deviation | Spatial sky 16325A emission deviations (filled: sky, open: star) | Spatial sky continuum emission | Spatial sky telluric CO2 absorption deviations (filled: H < 10) | |||||||||||||||||||||||
| 0 | 0 |
|
|
|
|
|
|
| IPAIR | NAME | SHIFT | NEWSHIFT | S/N | NAME | SHIFT | NEWSHIFT | S/N |
| 0 | 09980041 | 0.522553 | 0.00000 | 18.7159 | 09980040 | 0.000446432 | 0.522107 | 18.5966 |
| 1 | 09980037 | 0.522092 | 0.000461042 | 18.9256 | 09980036 | 0.00000 | 0.522553 | 18.9481 |
| 2 | 09980038 | 0.522334 | 0.000219047 | 18.8412 | 09980039 | 0.000550099 | 0.522003 | 18.8422 |
| 3 | 09980042 | 0.522496 | 5.70416e-05 | 18.5528 | 09980043 | 0.00119432 | 0.521359 | 18.5376 |