| Red | Green | Blue | |
| z | 17.64 | ||
| znorm | Inf | ||
| sky | -Inf | -Inf | -Inf |
| S/N | 27.8 | 46.9 | 49.9 |
| S/N(c) | 0.0 | 0.0 | 0.0 |
| SN(E/C) |
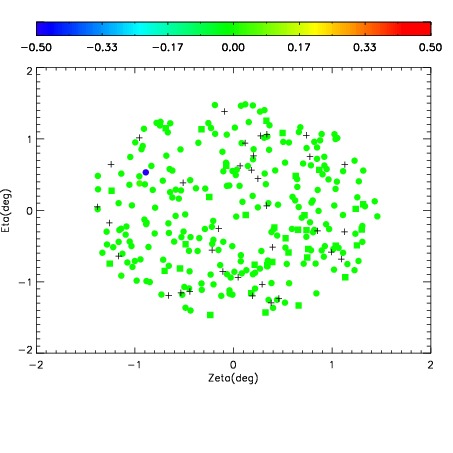
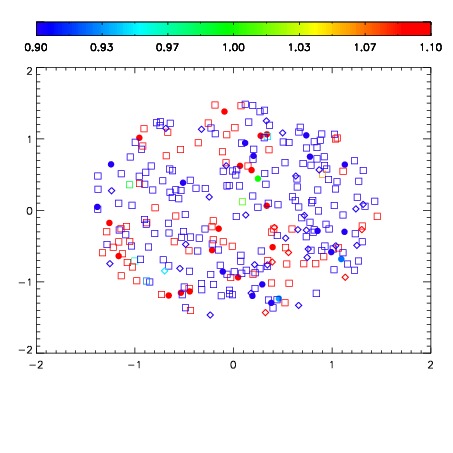
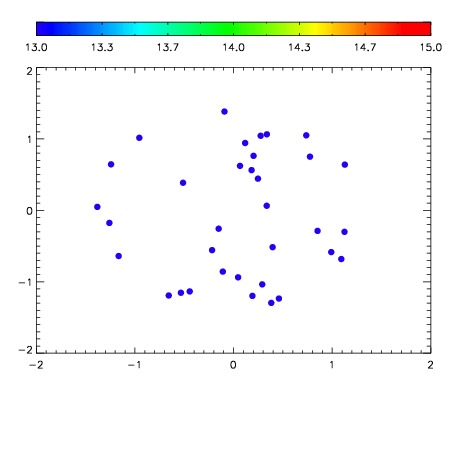

| Frame | Nreads | Zeropoints | Mag plots | Spatial mag deviation | Spatial sky 16325A emission deviations (filled: sky, open: star) | Spatial sky continuum emission | Spatial sky telluric CO2 absorption deviations (filled: H < 10) | |||||||||||||||||||||||
| 0 | 0 |
|
|
|
|
|
|
| IPAIR | NAME | SHIFT | NEWSHIFT | S/N | NAME | SHIFT | NEWSHIFT | S/N |
| 0 | 10240043 | 0.498610 | 0.00000 | 19.1316 | 10240041 | 0.00129021 | 0.497320 | 19.1187 |
| 1 | 10240038 | 0.497837 | 0.000772983 | 19.1444 | 10240037 | 0.00000 | 0.498610 | 19.1384 |
| 2 | 10240039 | 0.497944 | 0.000665992 | 19.1281 | 10240044 | -0.000772251 | 0.499382 | 19.0958 |
| 3 | 10240042 | 0.498586 | 2.39909e-05 | 19.1210 | 10240040 | 0.00208963 | 0.496520 | 19.0934 |