| Red | Green | Blue | |
| z | 17.63 | ||
| znorm | Inf | ||
| sky | -NaN | -NaN | -Inf |
| S/N | 23.2 | 42.1 | 44.2 |
| S/N(c) | 0.0 | 0.0 | 0.0 |
| SN(E/C) |
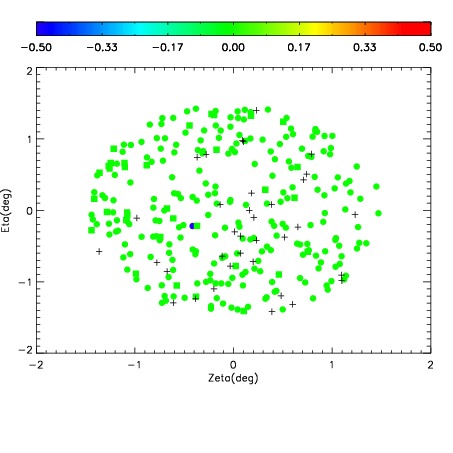
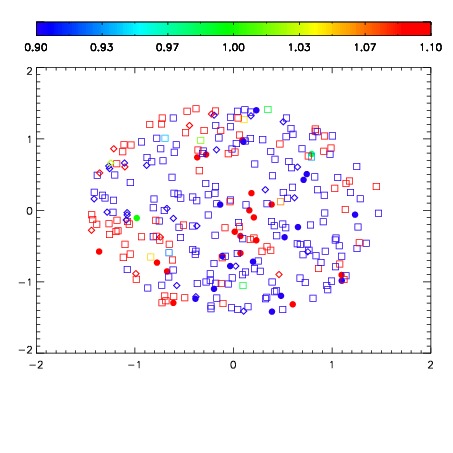
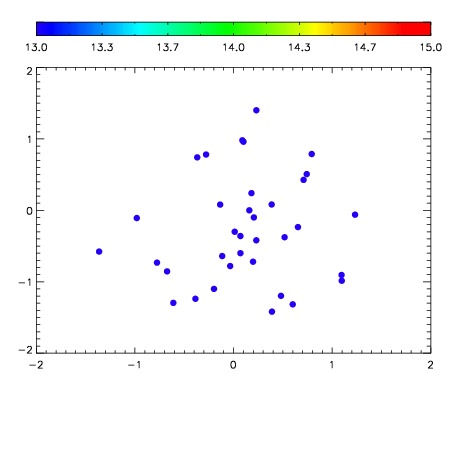

| Frame | Nreads | Zeropoints | Mag plots | Spatial mag deviation | Spatial sky 16325A emission deviations (filled: sky, open: star) | Spatial sky continuum emission | Spatial sky telluric CO2 absorption deviations (filled: H < 10) | |||||||||||||||||||||||
| 0 | 0 |
|
|
|
|
|
|
| IPAIR | NAME | SHIFT | NEWSHIFT | S/N | NAME | SHIFT | NEWSHIFT | S/N |
| 0 | 06650054 | 0.479378 | 0.00000 | 18.9854 | 06650055 | -0.000804391 | 0.480182 | 19.0342 |
| 1 | 06650053 | 0.478990 | 0.000388026 | 18.9604 | 06650051 | -0.000863134 | 0.480241 | 18.9454 |
| 2 | 06650050 | 0.478534 | 0.000844002 | 18.9484 | 06650052 | 0.000460988 | 0.478917 | 18.9040 |
| 3 | 06650049 | 0.477647 | 0.00173101 | 18.9109 | 06650048 | 0.00000 | 0.479378 | 18.6117 |