| Red | Green | Blue | |
| z | 17.63 | ||
| znorm | Inf | ||
| sky | -NaN | -NaN | -Inf |
| S/N | 26.9 | 46.4 | 49.5 |
| S/N(c) | 0.0 | 0.0 | 0.0 |
| SN(E/C) |
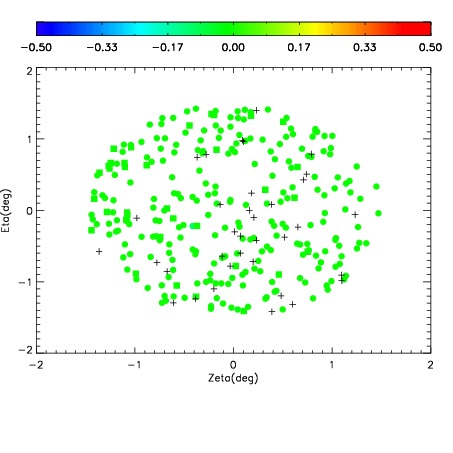
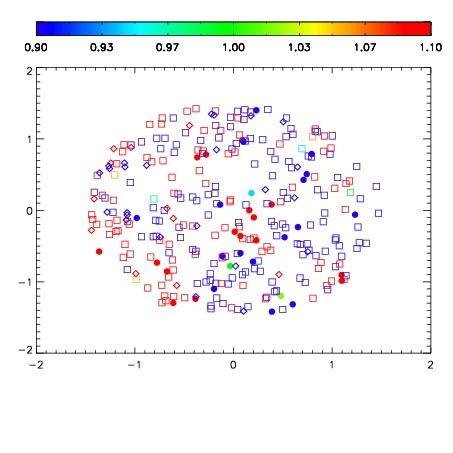
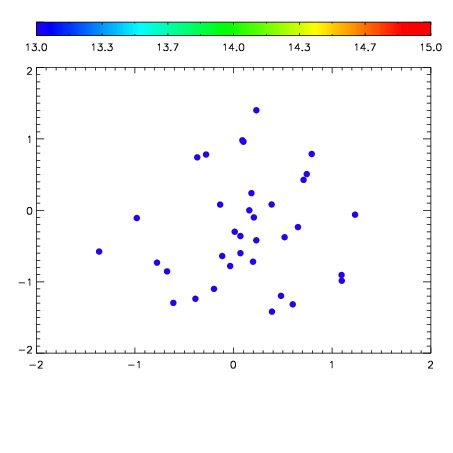

| Frame | Nreads | Zeropoints | Mag plots | Spatial mag deviation | Spatial sky 16325A emission deviations (filled: sky, open: star) | Spatial sky continuum emission | Spatial sky telluric CO2 absorption deviations (filled: H < 10) | |||||||||||||||||||||||
| 0 | 0 |
|
|
|
|
|
|
| IPAIR | NAME | SHIFT | NEWSHIFT | S/N | NAME | SHIFT | NEWSHIFT | S/N |
| 0 | 06690041 | 0.484681 | 0.00000 | 19.0624 | 06690044 | -0.000399415 | 0.485080 | 19.0775 |
| 1 | 06690046 | 0.484520 | 0.000161022 | 19.0968 | 06690040 | 0.00000 | 0.484681 | 19.1026 |
| 2 | 06690042 | 0.484287 | 0.000394017 | 19.0667 | 06690047 | 0.00377322 | 0.480908 | 19.1019 |
| 3 | 06690045 | 0.483660 | 0.00102100 | 19.0468 | 06690043 | 0.00229439 | 0.482387 | 19.0530 |