| Red | Green | Blue | |
| z | 17.64 | ||
| znorm | Inf | ||
| sky | -Inf | -Inf | -Inf |
| S/N | 27.3 | 45.5 | 47.3 |
| S/N(c) | 0.0 | 0.0 | 0.0 |
| SN(E/C) |
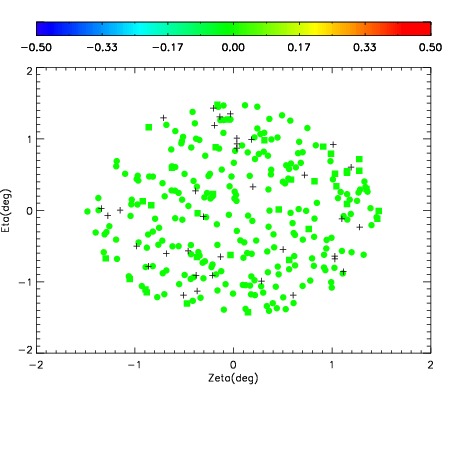

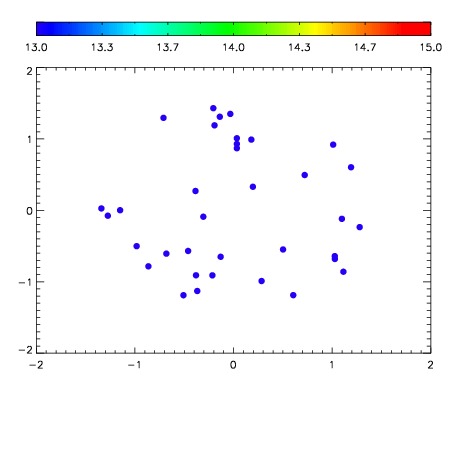

| Frame | Nreads | Zeropoints | Mag plots | Spatial mag deviation | Spatial sky 16325A emission deviations (filled: sky, open: star) | Spatial sky continuum emission | Spatial sky telluric CO2 absorption deviations (filled: H < 10) | |||||||||||||||||||||||
| 0 | 0 |
|
|
|
|
|
|
| IPAIR | NAME | SHIFT | NEWSHIFT | S/N | NAME | SHIFT | NEWSHIFT | S/N |
| 0 | 06920054 | 0.499964 | 0.00000 | 18.9843 | 06920055 | 0.00503797 | 0.494926 | 18.9992 |
| 1 | 06920057 | 0.498668 | 0.00129601 | 19.0743 | 06920059 | 0.00367489 | 0.496289 | 19.1092 |
| 2 | 06920058 | 0.498565 | 0.00139901 | 19.0648 | 06920056 | 0.00317236 | 0.496792 | 19.0220 |
| 3 | 06920053 | 0.499249 | 0.000714988 | 18.9154 | 06920052 | 0.00000 | 0.499964 | 18.8807 |