| Red | Green | Blue | |
| z | 17.64 | ||
| znorm | Inf | ||
| sky | -Inf | -Inf | -Inf |
| S/N | 19.0 | 31.1 | 33.4 |
| S/N(c) | 0.0 | 0.0 | 0.0 |
| SN(E/C) |
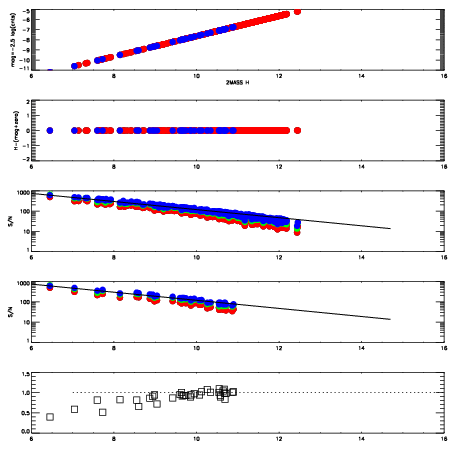
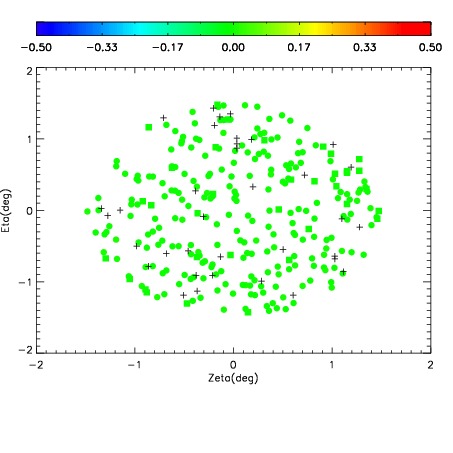
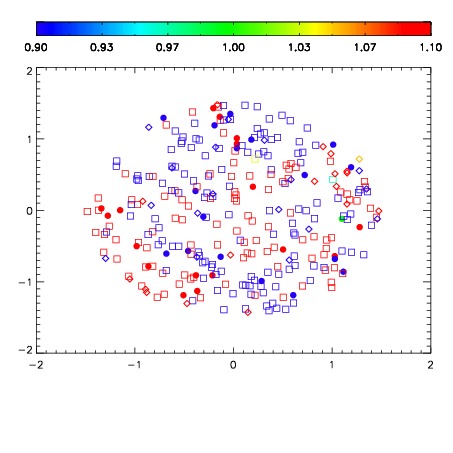
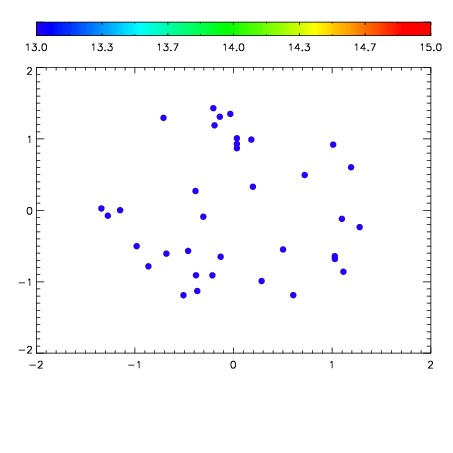

| Frame | Nreads | Zeropoints | Mag plots | Spatial mag deviation | Spatial sky 16325A emission deviations (filled: sky, open: star) | Spatial sky continuum emission | Spatial sky telluric CO2 absorption deviations (filled: H < 10) | |||||||||||||||||||||||
| 0 | 0 |
|
|
|
|
|
|
| IPAIR | NAME | SHIFT | NEWSHIFT | S/N | NAME | SHIFT | NEWSHIFT | S/N |
| 0 | 06980050 | 0.483411 | 0.00000 | 18.3514 | 06980051 | 0.00279155 | 0.480619 | 18.0801 |
| 1 | 06980054 | 0.483367 | 4.40180e-05 | 18.8142 | 06980055 | 0.00262093 | 0.480790 | 19.0615 |
| 2 | 06980053 | 0.482479 | 0.000932008 | 18.7989 | 06980048 | 0.00000 | 0.483411 | 18.8937 |
| 3 | 06980049 | 0.482838 | 0.000573009 | 18.4772 | 06980052 | 0.00120351 | 0.482208 | 18.4908 |