| Red | Green | Blue | |
| z | 17.64 | ||
| znorm | Inf | ||
| sky | -Inf | -Inf | -NaN |
| S/N | 25.3 | 41.2 | 41.4 |
| S/N(c) | 0.0 | 0.0 | 0.0 |
| SN(E/C) |
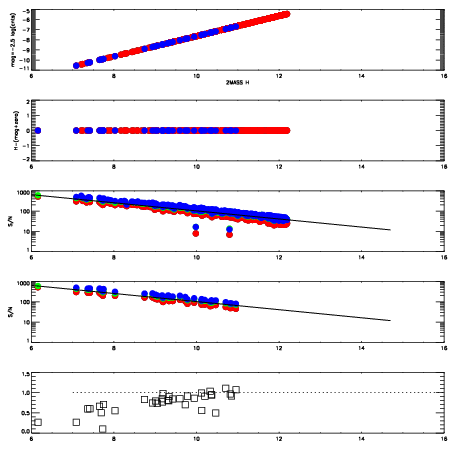
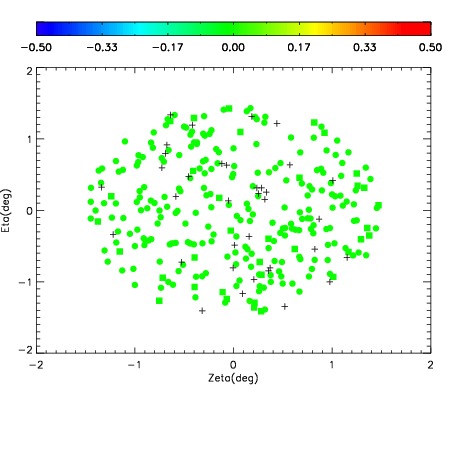
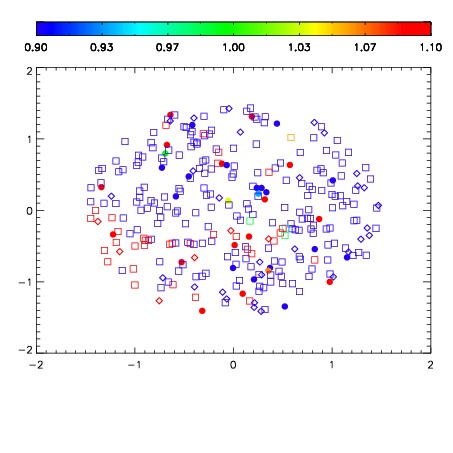


| Frame | Nreads | Zeropoints | Mag plots | Spatial mag deviation | Spatial sky 16325A emission deviations (filled: sky, open: star) | Spatial sky continuum emission | Spatial sky telluric CO2 absorption deviations (filled: H < 10) | |||||||||||||||||||||||
| 0 | 0 |
|
|
|
|
|
|
| IPAIR | NAME | SHIFT | NEWSHIFT | S/N | NAME | SHIFT | NEWSHIFT | S/N |
| 0 | 06120030 | 0.480314 | 0.00000 | 19.1361 | 06120029 | 0.00000 | 0.480314 | 19.1250 |
| 1 | 06120031 | 0.480021 | 0.000292987 | 19.1455 | 06120032 | -0.00281217 | 0.483126 | 19.1448 |
| 2 | 06120034 | 0.478885 | 0.00142899 | 18.9707 | 06120033 | -0.00346240 | 0.483776 | 19.1199 |