| Red | Green | Blue | |
| z | 17.64 | ||
| znorm | Inf | ||
| sky | -NaN | -NaN | -Inf |
| S/N | 29.0 | 45.7 | 49.6 |
| S/N(c) | 0.0 | 0.0 | 0.0 |
| SN(E/C) |
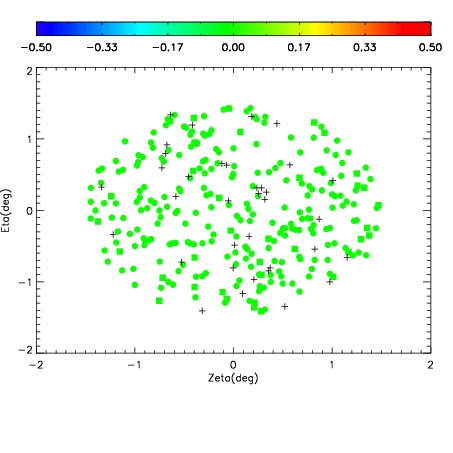
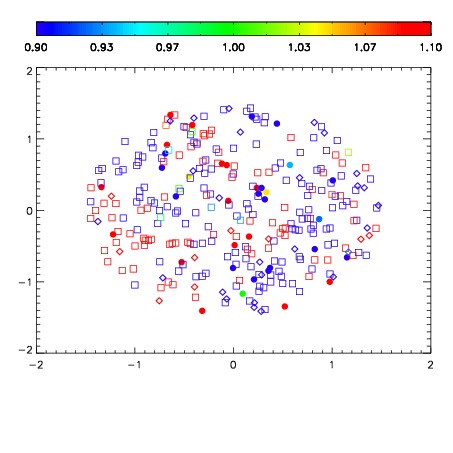
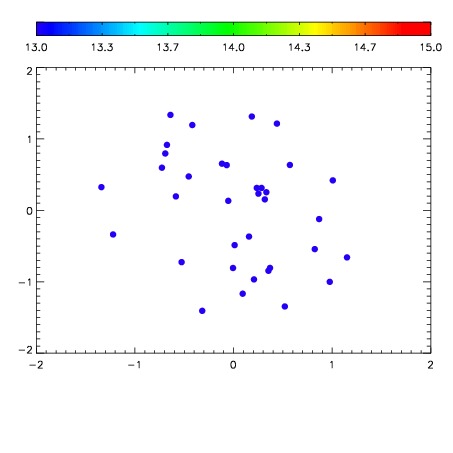

| Frame | Nreads | Zeropoints | Mag plots | Spatial mag deviation | Spatial sky 16325A emission deviations (filled: sky, open: star) | Spatial sky continuum emission | Spatial sky telluric CO2 absorption deviations (filled: H < 10) | |||||||||||||||||||||||
| 0 | 0 |
|
|
|
|
|
|
| IPAIR | NAME | SHIFT | NEWSHIFT | S/N | NAME | SHIFT | NEWSHIFT | S/N |
| 0 | 06690057 | 0.484408 | 0.00000 | 19.1357 | 06690058 | 0.00674359 | 0.477664 | 19.1191 |
| 1 | 06690056 | 0.484130 | 0.000277996 | 19.1273 | 06690051 | 0.00000 | 0.484408 | 19.0902 |
| 2 | 06690052 | 0.482760 | 0.00164798 | 19.0304 | 06690055 | 0.000503748 | 0.483904 | 19.0830 |
| 3 | 06690053 | 0.483351 | 0.00105700 | 18.9877 | 06690054 | 0.00402596 | 0.480382 | 19.0510 |