| Red | Green | Blue | |
| z | 17.64 | ||
| znorm | Inf | ||
| sky | -Inf | -Inf | -Inf |
| S/N | 27.3 | 46.1 | 49.3 |
| S/N(c) | 0.0 | 0.0 | 0.0 |
| SN(E/C) |
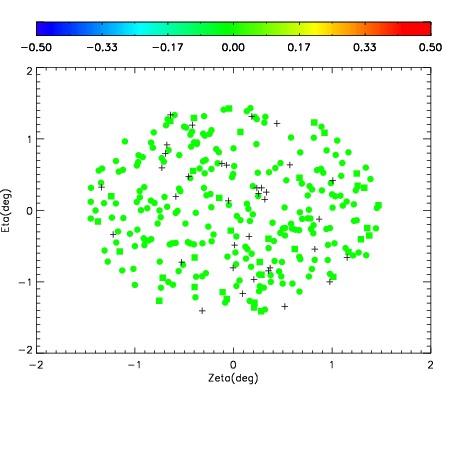
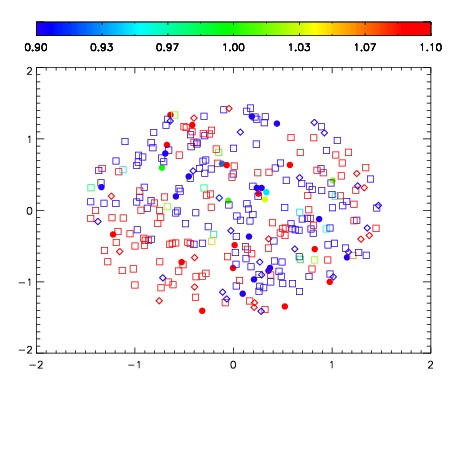
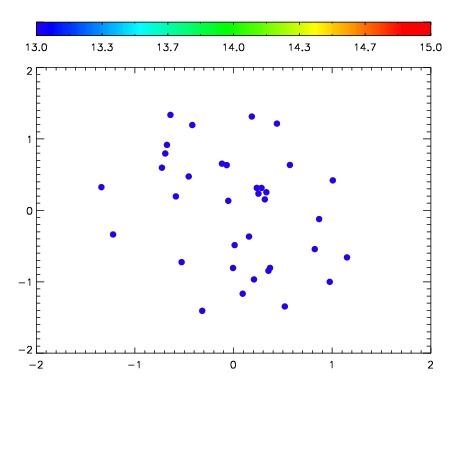

| Frame | Nreads | Zeropoints | Mag plots | Spatial mag deviation | Spatial sky 16325A emission deviations (filled: sky, open: star) | Spatial sky continuum emission | Spatial sky telluric CO2 absorption deviations (filled: H < 10) | |||||||||||||||||||||||
| 0 | 0 |
|
|
|
|
|
|
| IPAIR | NAME | SHIFT | NEWSHIFT | S/N | NAME | SHIFT | NEWSHIFT | S/N |
| 0 | 06740027 | 0.492813 | 0.00000 | 19.1072 | 06740032 | 0.00317165 | 0.489641 | 19.0967 |
| 1 | 06740030 | 0.489856 | 0.00295699 | 19.1516 | 06740029 | 7.94742e-05 | 0.492734 | 19.1325 |
| 2 | 06740031 | 0.490831 | 0.00198200 | 19.1339 | 06740028 | -0.000717748 | 0.493531 | 19.1318 |
| 3 | 06740026 | 0.491488 | 0.00132498 | 19.1038 | 06740025 | 0.00000 | 0.492813 | 19.0388 |