| Red | Green | Blue | |
| z | 17.64 | ||
| znorm | Inf | ||
| sky | -NaN | -Inf | -Inf |
| S/N | 26.2 | 40.4 | 43.8 |
| S/N(c) | 0.0 | 0.0 | 0.0 |
| SN(E/C) |
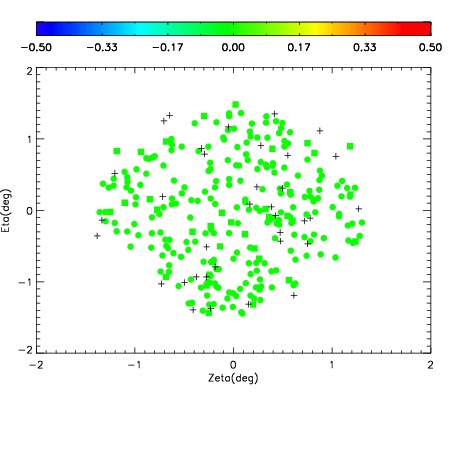
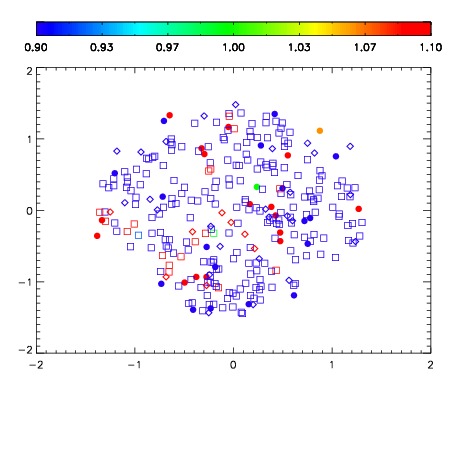


| Frame | Nreads | Zeropoints | Mag plots | Spatial mag deviation | Spatial sky 16325A emission deviations (filled: sky, open: star) | Spatial sky continuum emission | Spatial sky telluric CO2 absorption deviations (filled: H < 10) | |||||||||||||||||||||||
| 0 | 0 |
|
|
|
|
|
|
| IPAIR | NAME | SHIFT | NEWSHIFT | S/N | NAME | SHIFT | NEWSHIFT | S/N |
| 0 | 08760064 | 0.473613 | 0.00000 | 18.6509 | 08760066 | 0.00232840 | 0.471285 | 18.6999 |
| 1 | 08760065 | 0.472906 | 0.000707000 | 18.6687 | 08760067 | 0.00162064 | 0.471992 | 18.7314 |
| 2 | 08760069 | 0.470798 | 0.00281501 | 18.6337 | 08760063 | 0.00000 | 0.473613 | 18.6070 |
| 3 | 08760068 | 0.471164 | 0.00244901 | 18.5705 | 08760070 | 0.00343495 | 0.470178 | 18.5721 |