| Red | Green | Blue | |
| z | 17.64 | ||
| znorm | Inf | ||
| sky | -Inf | -Inf | -Inf |
| S/N | 33.9 | 54.1 | 54.6 |
| S/N(c) | 0.0 | 0.0 | 0.0 |
| SN(E/C) |
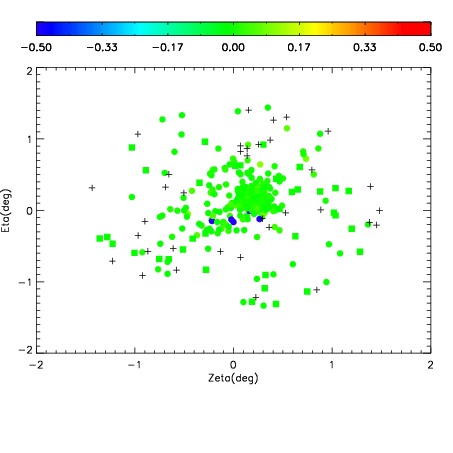
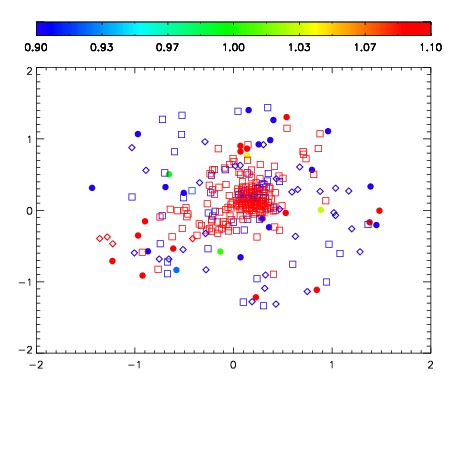
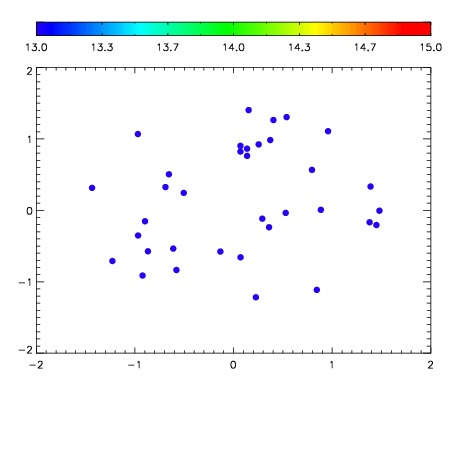

| Frame | Nreads | Zeropoints | Mag plots | Spatial mag deviation | Spatial sky 16325A emission deviations (filled: sky, open: star) | Spatial sky continuum emission | Spatial sky telluric CO2 absorption deviations (filled: H < 10) | |||||||||||||||||||||||
| 0 | 0 |
|
|
|
|
|
|
| IPAIR | NAME | SHIFT | NEWSHIFT | S/N | NAME | SHIFT | NEWSHIFT | S/N |
| 0 | 06100091 | 0.485076 | 0.00000 | 19.2345 | 06100092 | 0.00282295 | 0.482253 | 19.0510 |
| 1 | 06100087 | 0.484412 | 0.000663996 | 19.2564 | 06100088 | 0.000343602 | 0.484732 | 19.2595 |
| 2 | 06100090 | 0.484638 | 0.000438005 | 19.2563 | 06100089 | 0.000565570 | 0.484510 | 19.2488 |
| 3 | 06100086 | 0.484438 | 0.000638008 | 19.2535 | 06100085 | 0.00000 | 0.485076 | 19.2444 |