| Red | Green | Blue | |
| z | 17.64 | ||
| znorm | Inf | ||
| sky | -Inf | -Inf | -NaN |
| S/N | 27.7 | 46.0 | 45.0 |
| S/N(c) | 0.0 | 0.0 | 0.0 |
| SN(E/C) |

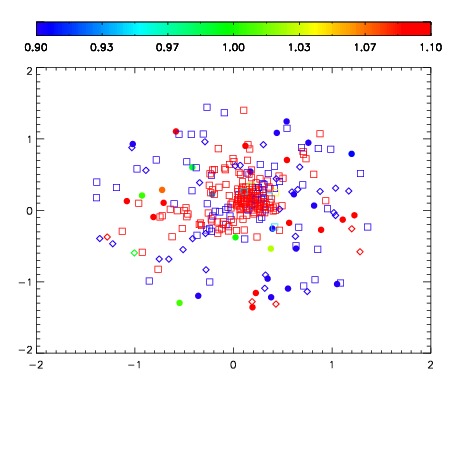


| Frame | Nreads | Zeropoints | Mag plots | Spatial mag deviation | Spatial sky 16325A emission deviations (filled: sky, open: star) | Spatial sky continuum emission | Spatial sky telluric CO2 absorption deviations (filled: H < 10) | |||||||||||||||||||||||
| 0 | 0 |
|
|
|
|
|
|
| IPAIR | NAME | SHIFT | NEWSHIFT | S/N | NAME | SHIFT | NEWSHIFT | S/N |
| 0 | 06080070 | 0.486844 | 0.00000 | 18.6740 | 06080069 | 0.00000 | 0.486844 | 18.6732 |
| 1 | 06080074 | 0.484597 | 0.00224701 | 19.0399 | 06080073 | -0.00219585 | 0.489040 | 19.0501 |
| 2 | 06080071 | 0.486378 | 0.000465989 | 18.8922 | 06080072 | 0.00172734 | 0.485117 | 19.0303 |
| 3 | 06080075 | 0.484715 | 0.00212899 | 18.8551 | 06080076 | 0.000260294 | 0.486584 | 18.8611 |