| Red | Green | Blue | |
| z | 17.64 | ||
| znorm | Inf | ||
| sky | -Inf | -Inf | -Inf |
| S/N | 32.9 | 54.3 | 53.6 |
| S/N(c) | 0.0 | 0.0 | 0.0 |
| SN(E/C) |
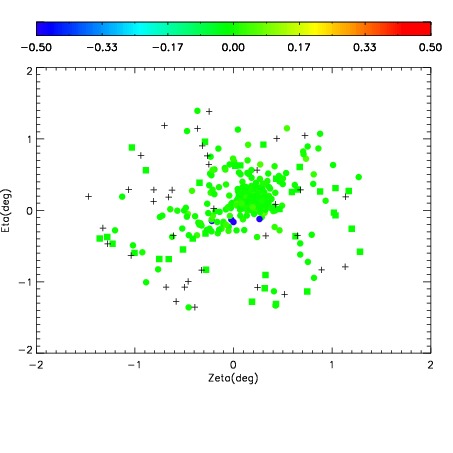
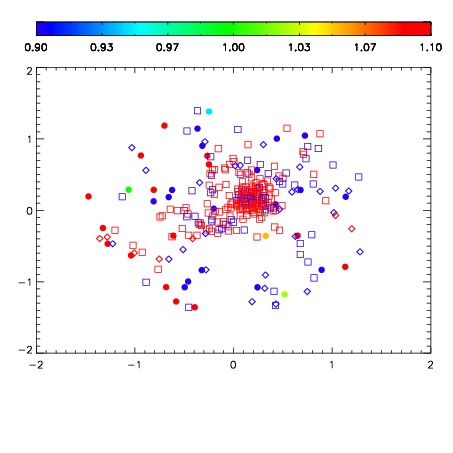
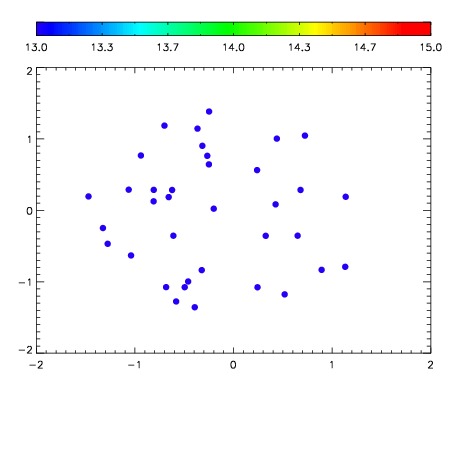

| Frame | Nreads | Zeropoints | Mag plots | Spatial mag deviation | Spatial sky 16325A emission deviations (filled: sky, open: star) | Spatial sky continuum emission | Spatial sky telluric CO2 absorption deviations (filled: H < 10) | |||||||||||||||||||||||
| 0 | 0 |
|
|
|
|
|
|
| IPAIR | NAME | SHIFT | NEWSHIFT | S/N | NAME | SHIFT | NEWSHIFT | S/N |
| 0 | 06090090 | 0.481028 | 0.00000 | 19.1555 | 06090091 | 0.00355795 | 0.477470 | 19.1981 |
| 1 | 06090089 | 0.480512 | 0.000515997 | 19.0626 | 06090092 | 0.00205435 | 0.478974 | 19.1027 |
| 2 | 06090093 | 0.480784 | 0.000243992 | 18.9516 | 06090084 | 0.00000 | 0.481028 | 19.0193 |
| 3 | 06090085 | 0.478481 | 0.00254700 | 18.9433 | 06090087 | 0.00103954 | 0.479988 | 19.0082 |
| 4 | 06090086 | 0.479926 | 0.00110200 | 18.9377 | 06090088 | -0.000580093 | 0.481608 | 18.9804 |