| Red | Green | Blue | |
| z | 17.64 | ||
| znorm | Inf | ||
| sky | -Inf | -Inf | -Inf |
| S/N | 38.0 | 60.1 | 57.6 |
| S/N(c) | 0.0 | 0.0 | 0.0 |
| SN(E/C) |
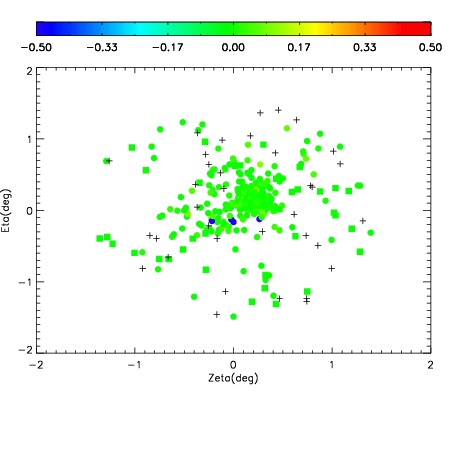
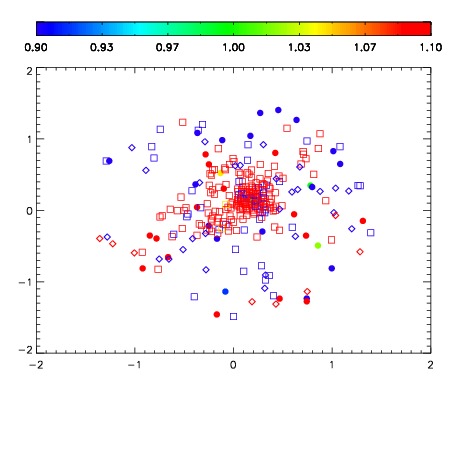


| Frame | Nreads | Zeropoints | Mag plots | Spatial mag deviation | Spatial sky 16325A emission deviations (filled: sky, open: star) | Spatial sky continuum emission | Spatial sky telluric CO2 absorption deviations (filled: H < 10) | |||||||||||||||||||||||
| 0 | 0 |
|
|
|
|
|
|
| IPAIR | NAME | SHIFT | NEWSHIFT | S/N | NAME | SHIFT | NEWSHIFT | S/N |
| 0 | 06730028 | 0.485956 | 0.00000 | 19.2876 | 06730029 | -0.00832479 | 0.494281 | 19.2725 |
| 1 | 06730027 | 0.483106 | 0.00285003 | 19.3095 | 06730033 | -0.00557291 | 0.491529 | 19.3077 |
| 2 | 06730032 | 0.485119 | 0.000837028 | 19.3069 | 06730030 | -0.00928649 | 0.495243 | 19.3071 |
| 3 | 06730031 | 0.482128 | 0.00382802 | 19.3053 | 06730026 | 0.00000 | 0.485956 | 19.2837 |