| Red | Green | Blue | |
| z | 17.64 | ||
| znorm | Inf | ||
| sky | -Inf | -Inf | -Inf |
| S/N | 38.3 | 60.4 | 59.1 |
| S/N(c) | 0.0 | 0.0 | 0.0 |
| SN(E/C) |
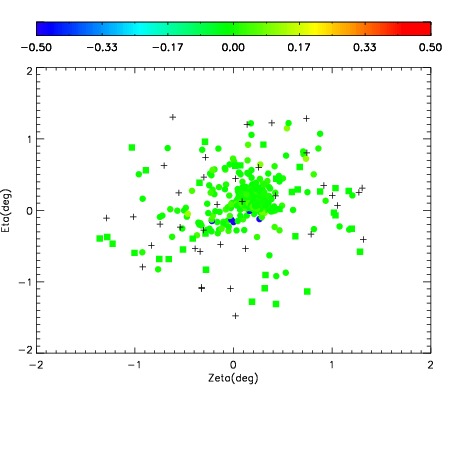
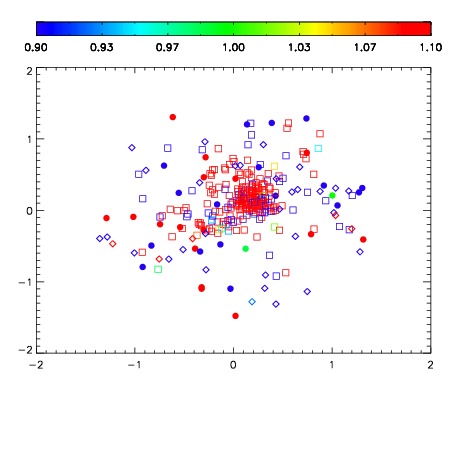
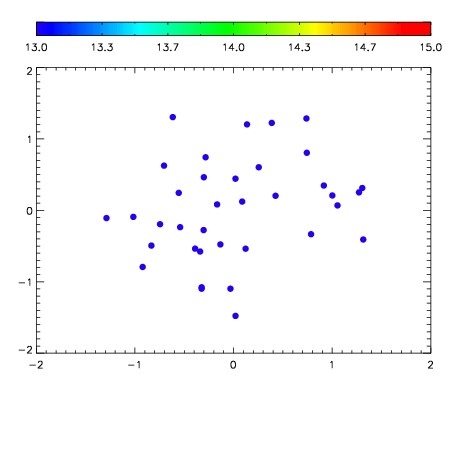

| Frame | Nreads | Zeropoints | Mag plots | Spatial mag deviation | Spatial sky 16325A emission deviations (filled: sky, open: star) | Spatial sky continuum emission | Spatial sky telluric CO2 absorption deviations (filled: H < 10) | |||||||||||||||||||||||
| 0 | 0 |
|
|
|
|
|
|
| IPAIR | NAME | SHIFT | NEWSHIFT | S/N | NAME | SHIFT | NEWSHIFT | S/N |
| 0 | 07000046 | 0.481185 | 0.00000 | 19.1625 | 07000044 | 0.00134657 | 0.479838 | 19.1515 |
| 1 | 07000038 | 0.477862 | 0.00332299 | 19.2317 | 07000045 | -6.02893e-05 | 0.481245 | 19.2202 |
| 2 | 07000039 | 0.480650 | 0.000534981 | 19.1927 | 07000040 | 0.00115839 | 0.480027 | 19.1565 |
| 3 | 07000042 | 0.480381 | 0.000803977 | 19.1329 | 07000041 | -0.000224991 | 0.481410 | 19.1300 |
| 4 | 07000043 | 0.480840 | 0.000344992 | 19.1312 | 07000037 | 0.00000 | 0.481185 | 19.1237 |