| Red | Green | Blue | |
| z | 17.64 | ||
| znorm | Inf | ||
| sky | -Inf | -Inf | -Inf |
| S/N | 26.2 | 44.2 | 42.2 |
| S/N(c) | 0.0 | 0.0 | 0.0 |
| SN(E/C) |
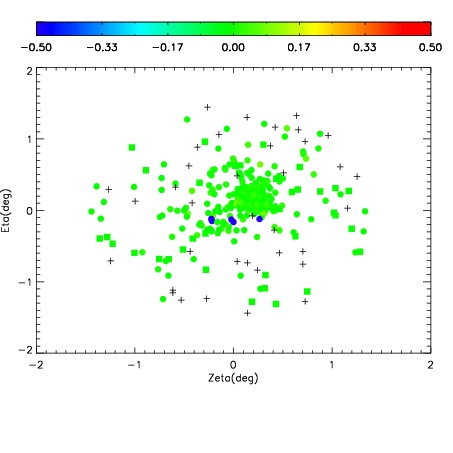


| Frame | Nreads | Zeropoints | Mag plots | Spatial mag deviation | Spatial sky 16325A emission deviations (filled: sky, open: star) | Spatial sky continuum emission | Spatial sky telluric CO2 absorption deviations (filled: H < 10) | |||||||||||||||||||||||
| 0 | 0 |
|
|
|
|
|
|
| IPAIR | NAME | SHIFT | NEWSHIFT | S/N | NAME | SHIFT | NEWSHIFT | S/N |
| 0 | 07200032 | 0.476649 | 0.00000 | 18.6535 | 07200033 | 0.00305424 | 0.473595 | 18.7132 |
| 1 | 07200027 | 0.474072 | 0.00257698 | 18.9344 | 07200026 | 0.00000 | 0.476649 | 18.9548 |
| 2 | 07200028 | 0.474656 | 0.00199300 | 18.8741 | 07200029 | 0.000264040 | 0.476385 | 18.9102 |
| 3 | 07200031 | 0.476294 | 0.000354975 | 18.7428 | 07200030 | 0.00151033 | 0.475139 | 18.8257 |