| Red | Green | Blue | |
| z | 17.64 | ||
| znorm | Inf | ||
| sky | -Inf | -Inf | -Inf |
| S/N | 28.5 | 47.1 | 45.2 |
| S/N(c) | 0.0 | 0.0 | 0.0 |
| SN(E/C) |
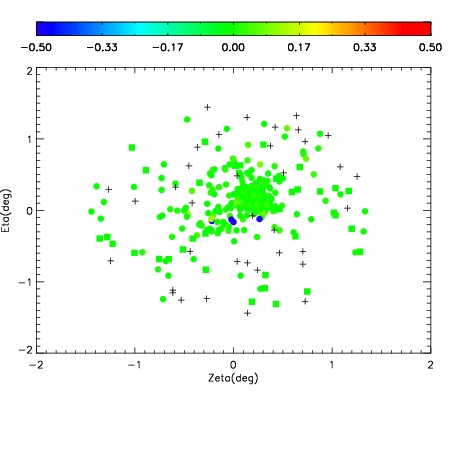
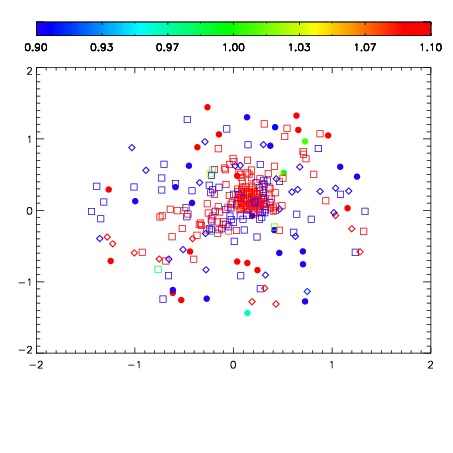
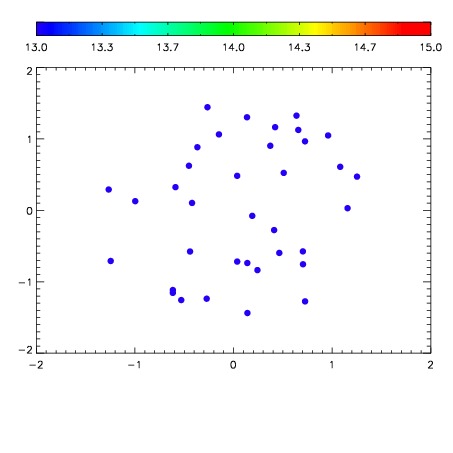

| Frame | Nreads | Zeropoints | Mag plots | Spatial mag deviation | Spatial sky 16325A emission deviations (filled: sky, open: star) | Spatial sky continuum emission | Spatial sky telluric CO2 absorption deviations (filled: H < 10) | |||||||||||||||||||||||
| 0 | 0 |
|
|
|
|
|
|
| IPAIR | NAME | SHIFT | NEWSHIFT | S/N | NAME | SHIFT | NEWSHIFT | S/N |
| 0 | 07210028 | 0.484033 | 0.00000 | 18.9668 | 07210033 | 0.00186321 | 0.482170 | 18.9275 |
| 1 | 07210032 | 0.483819 | 0.000213981 | 19.1042 | 07210029 | -0.00205956 | 0.486093 | 19.0227 |
| 2 | 07210031 | 0.483678 | 0.000354975 | 18.9829 | 07210030 | -0.00186274 | 0.485896 | 18.9422 |
| 3 | 07210027 | 0.483685 | 0.000348002 | 18.8803 | 07210026 | 0.00000 | 0.484033 | 18.8137 |