| Red | Green | Blue | |
| z | 17.64 | ||
| znorm | Inf | ||
| sky | -NaN | -Inf | -NaN |
| S/N | 25.6 | 41.8 | 44.1 |
| S/N(c) | 0.0 | 0.0 | 0.0 |
| SN(E/C) |
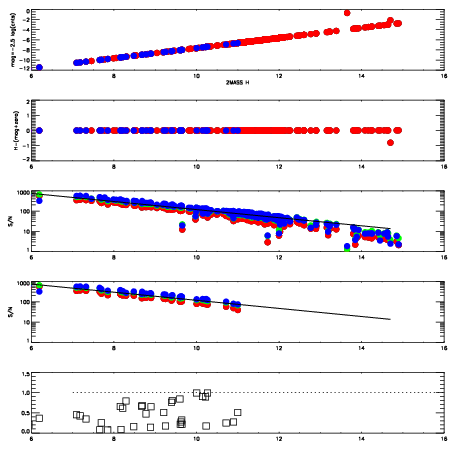
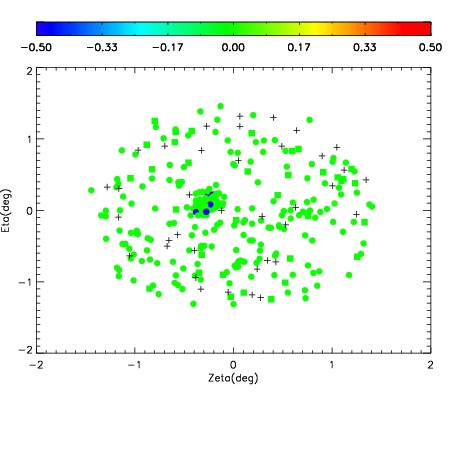
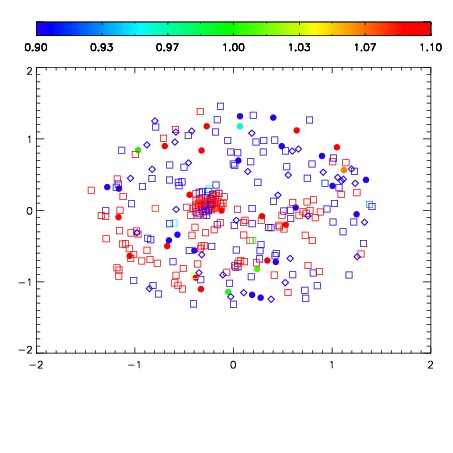
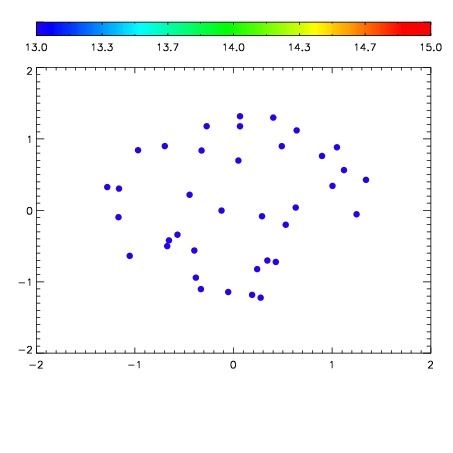

| Frame | Nreads | Zeropoints | Mag plots | Spatial mag deviation | Spatial sky 16325A emission deviations (filled: sky, open: star) | Spatial sky continuum emission | Spatial sky telluric CO2 absorption deviations (filled: H < 10) | |||||||||||||||||||||||
| 0 | 0 |
|
|
|
|
|
|
| IPAIR | NAME | SHIFT | NEWSHIFT | S/N | NAME | SHIFT | NEWSHIFT | S/N |
| 0 | 09990038 | 0.520660 | 0.00000 | 18.9687 | 09990040 | -0.00264072 | 0.523301 | 18.9136 |
| 1 | 09990039 | 0.519787 | 0.000872970 | 19.0597 | 09990044 | -0.00370183 | 0.524362 | 19.0069 |
| 2 | 09990043 | 0.515426 | 0.00523400 | 19.0445 | 09990041 | -0.00342109 | 0.524081 | 18.9585 |
| 3 | 09990042 | 0.515385 | 0.00527501 | 18.7374 | 09990037 | 0.00000 | 0.520660 | 18.4950 |