| Red | Green | Blue | |
| z | 17.64 | ||
| znorm | Inf | ||
| sky | -Inf | -NaN | -NaN |
| S/N | 30.3 | 48.2 | 50.5 |
| S/N(c) | 0.0 | 0.0 | 0.0 |
| SN(E/C) |
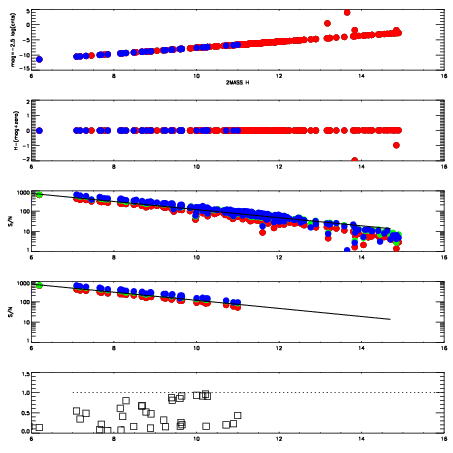


| Frame | Nreads | Zeropoints | Mag plots | Spatial mag deviation | Spatial sky 16325A emission deviations (filled: sky, open: star) | Spatial sky continuum emission | Spatial sky telluric CO2 absorption deviations (filled: H < 10) | |||||||||||||||||||||||
| 0 | 0 |
|
|
|
|
|
|
| IPAIR | NAME | SHIFT | NEWSHIFT | S/N | NAME | SHIFT | NEWSHIFT | S/N |
| 0 | 06740012 | 0.486369 | 0.00000 | 19.1083 | 06740017 | -0.000510220 | 0.486879 | 19.1127 |
| 1 | 06740016 | 0.484042 | 0.00232702 | 19.1888 | 06740014 | -0.00204730 | 0.488416 | 19.1722 |
| 2 | 06740015 | 0.482950 | 0.00341901 | 19.1654 | 06740013 | 0.00145503 | 0.484914 | 19.1610 |
| 3 | 06740011 | 0.484389 | 0.00198001 | 19.0387 | 06740010 | 0.00000 | 0.486369 | 18.9663 |