| Red | Green | Blue | |
| z | 17.64 | ||
| znorm | Inf | ||
| sky | -Inf | -Inf | -Inf |
| S/N | 28.4 | 45.8 | 47.2 |
| S/N(c) | 0.0 | 0.0 | 0.0 |
| SN(E/C) |
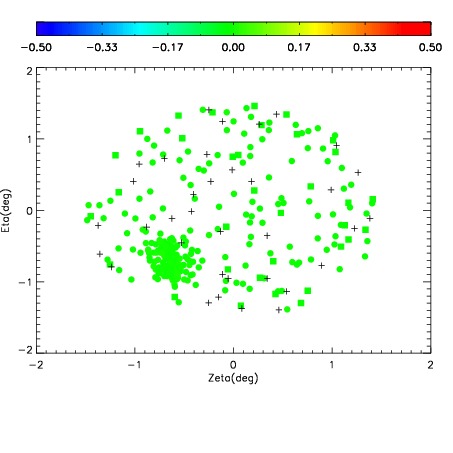
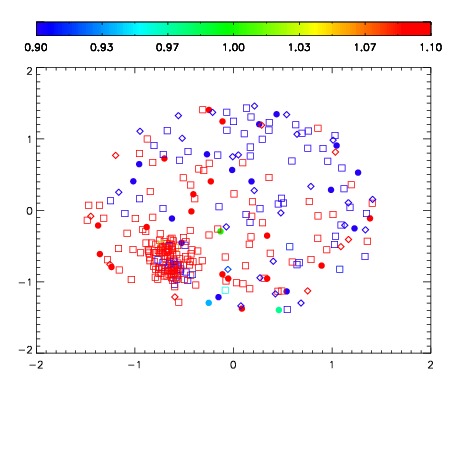


| Frame | Nreads | Zeropoints | Mag plots | Spatial mag deviation | Spatial sky 16325A emission deviations (filled: sky, open: star) | Spatial sky continuum emission | Spatial sky telluric CO2 absorption deviations (filled: H < 10) | |||||||||||||||||||||||
| 0 | 0 |
|
|
|
|
|
|
| IPAIR | NAME | SHIFT | NEWSHIFT | S/N | NAME | SHIFT | NEWSHIFT | S/N |
| 0 | 07530045 | 0.477385 | 0.00000 | 18.9665 | 07530043 | 0.000876267 | 0.476509 | 18.9423 |
| 1 | 07530040 | 0.474403 | 0.00298202 | 19.0748 | 07530039 | 0.00000 | 0.477385 | 19.0307 |
| 2 | 07530041 | 0.474849 | 0.00253603 | 19.0230 | 07530042 | 0.000579164 | 0.476806 | 19.0199 |
| 3 | 07530044 | 0.476017 | 0.00136802 | 19.0022 | 07530046 | 0.00277019 | 0.474615 | 19.0177 |