| Red | Green | Blue | |
| z | 17.64 | ||
| znorm | Inf | ||
| sky | -Inf | -Inf | -Inf |
| S/N | 27.4 | 45.3 | 47.8 |
| S/N(c) | 0.0 | 0.0 | 0.0 |
| SN(E/C) |
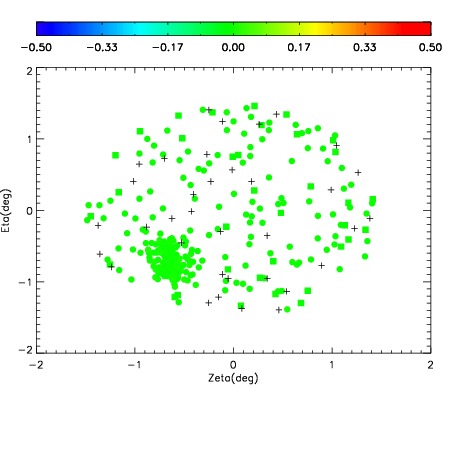
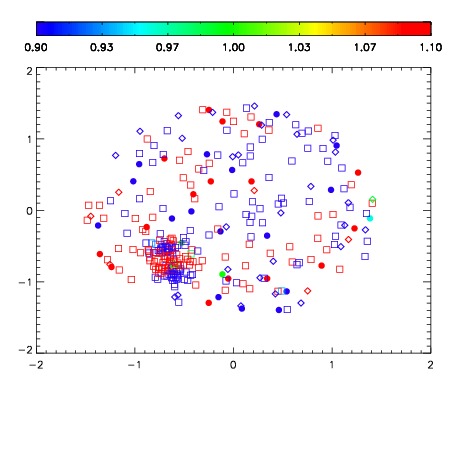


| Frame | Nreads | Zeropoints | Mag plots | Spatial mag deviation | Spatial sky 16325A emission deviations (filled: sky, open: star) | Spatial sky continuum emission | Spatial sky telluric CO2 absorption deviations (filled: H < 10) | |||||||||||||||||||||||
| 0 | 0 |
|
|
|
|
|
|
| IPAIR | NAME | SHIFT | NEWSHIFT | S/N | NAME | SHIFT | NEWSHIFT | S/N |
| 0 | 07610013 | 0.485727 | 0.00000 | 19.0327 | 07610011 | 0.00000 | 0.485727 | 18.9646 |
| 1 | 07610012 | 0.484129 | 0.00159800 | 19.0511 | 07610014 | 0.000985125 | 0.484742 | 19.0029 |
| 2 | 07610017 | 0.484167 | 0.00156000 | 18.8969 | 07610015 | 0.00192906 | 0.483798 | 18.9502 |
| 3 | 07610016 | 0.483292 | 0.00243500 | 18.8804 | 07610018 | 0.00238623 | 0.483341 | 18.9496 |