| Red | Green | Blue | |
| z | 17.64 | ||
| znorm | Inf | ||
| sky | -Inf | -Inf | -Inf |
| S/N | 23.5 | 38.5 | 40.2 |
| S/N(c) | 0.0 | 0.0 | 0.0 |
| SN(E/C) |
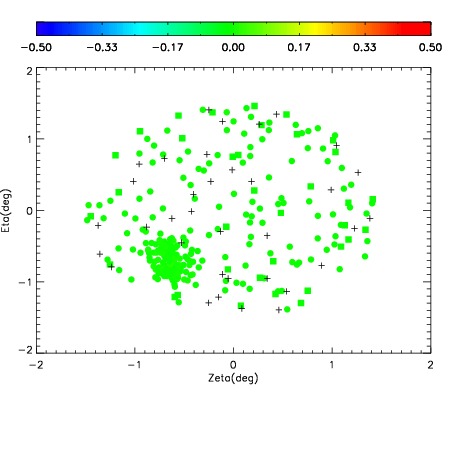

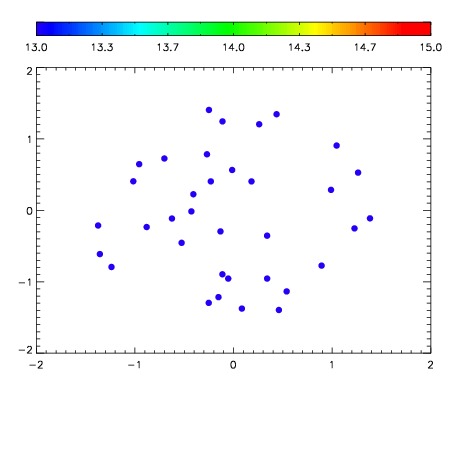

| Frame | Nreads | Zeropoints | Mag plots | Spatial mag deviation | Spatial sky 16325A emission deviations (filled: sky, open: star) | Spatial sky continuum emission | Spatial sky telluric CO2 absorption deviations (filled: H < 10) | |||||||||||||||||||||||
| 0 | 0 |
|
|
|
|
|
|
| IPAIR | NAME | SHIFT | NEWSHIFT | S/N | NAME | SHIFT | NEWSHIFT | S/N |
| 0 | 07840016 | 0.477166 | 0.00000 | 18.9036 | 07840015 | 0.000185212 | 0.476981 | 18.9385 |
| 1 | 07840017 | 0.476927 | 0.000238985 | 18.8699 | 07840018 | 0.000381087 | 0.476785 | 18.9244 |
| 2 | 07840012 | 0.475662 | 0.00150400 | 18.5927 | 07840014 | -9.05599e-05 | 0.477257 | 18.8408 |
| 3 | 07840013 | 0.475585 | 0.00158098 | 18.5194 | 07840011 | 0.00000 | 0.477166 | 18.6828 |