| Red | Green | Blue | |
| z | 17.64 | ||
| znorm | Inf | ||
| sky | -Inf | -NaN | -Inf |
| S/N | 30.1 | 52.3 | 55.2 |
| S/N(c) | 0.0 | 0.0 | 0.0 |
| SN(E/C) |
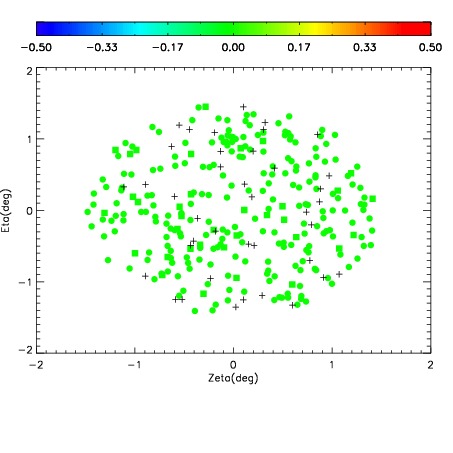
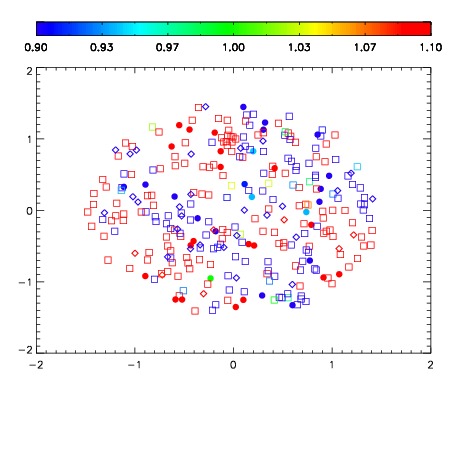
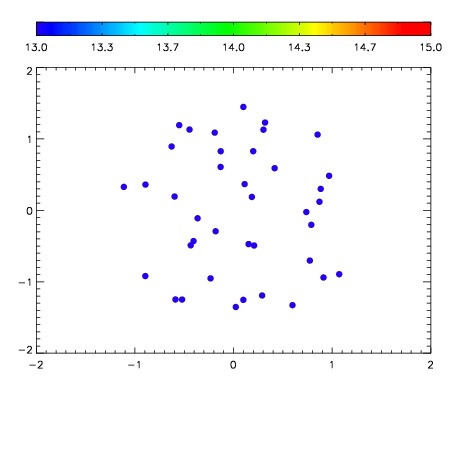

| Frame | Nreads | Zeropoints | Mag plots | Spatial mag deviation | Spatial sky 16325A emission deviations (filled: sky, open: star) | Spatial sky continuum emission | Spatial sky telluric CO2 absorption deviations (filled: H < 10) | |||||||||||||||||||||||
| 0 | 0 |
|
|
|
|
|
|
| IPAIR | NAME | SHIFT | NEWSHIFT | S/N | NAME | SHIFT | NEWSHIFT | S/N |
| 0 | 06090059 | 0.479131 | 0.00000 | 18.7186 | 06090061 | -0.00316667 | 0.482298 | 18.8474 |
| 1 | 06090067 | 0.474229 | 0.00490201 | 18.9022 | 06090069 | -0.00921954 | 0.488351 | 18.9117 |
| 2 | 06090063 | 0.474920 | 0.00421101 | 18.8704 | 06090062 | -0.00565965 | 0.484791 | 18.8934 |
| 3 | 06090068 | 0.474826 | 0.00430501 | 18.8565 | 06090066 | -0.00900968 | 0.488141 | 18.8672 |
| 4 | 06090060 | 0.478189 | 0.000942022 | 18.8367 | 06090065 | -0.00751221 | 0.486643 | 18.8663 |
| 5 | 06090064 | 0.476617 | 0.00251400 | 18.7075 | 06090058 | 0.00000 | 0.479131 | 18.7346 |