| Red | Green | Blue | |
| z | 17.64 | ||
| znorm | Inf | ||
| sky | -Inf | -Inf | -Inf |
| S/N | 30.3 | 51.1 | 54.1 |
| S/N(c) | 0.0 | 0.0 | 0.0 |
| SN(E/C) |
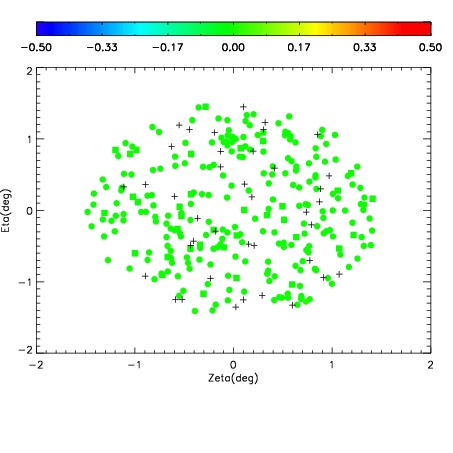
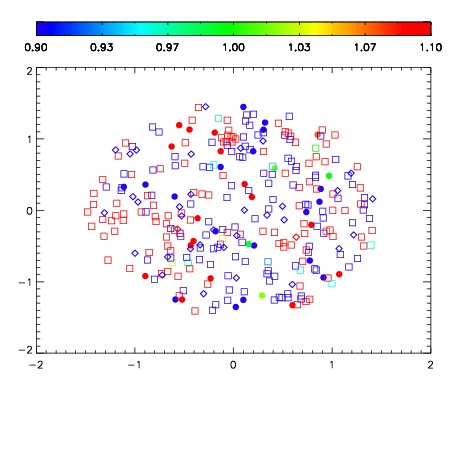
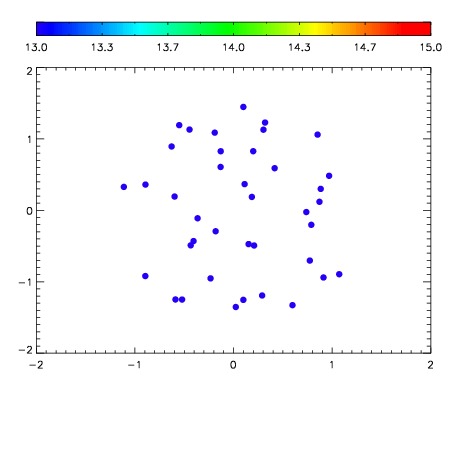

| Frame | Nreads | Zeropoints | Mag plots | Spatial mag deviation | Spatial sky 16325A emission deviations (filled: sky, open: star) | Spatial sky continuum emission | Spatial sky telluric CO2 absorption deviations (filled: H < 10) | |||||||||||||||||||||||
| 0 | 0 |
|
|
|
|
|
|
| IPAIR | NAME | SHIFT | NEWSHIFT | S/N | NAME | SHIFT | NEWSHIFT | S/N |
| 0 | 06150018 | 0.481798 | 0.00000 | 19.1839 | 06150019 | 0.000808078 | 0.480990 | 19.1546 |
| 1 | 06150021 | 0.473490 | 0.00830799 | 19.2117 | 06150023 | -0.00484104 | 0.486639 | 19.2195 |
| 2 | 06150022 | 0.479036 | 0.00276199 | 19.2111 | 06150020 | -0.00418952 | 0.485988 | 19.1925 |
| 3 | 06150017 | 0.477001 | 0.00479698 | 19.0148 | 06150016 | 0.00000 | 0.481798 | 18.9905 |