| Red | Green | Blue | |
| z | 17.64 | ||
| znorm | Inf | ||
| sky | -Inf | -Inf | -Inf |
| S/N | 23.4 | 44.2 | 45.7 |
| S/N(c) | 0.0 | 0.0 | 0.0 |
| SN(E/C) |
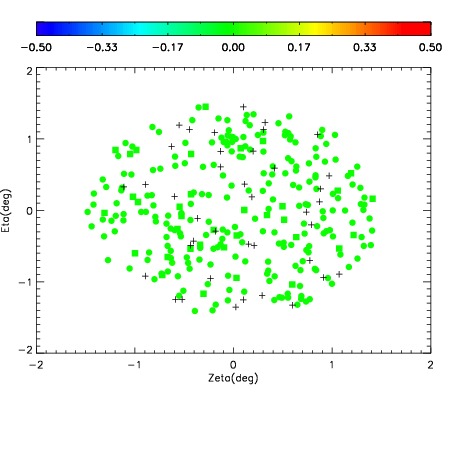
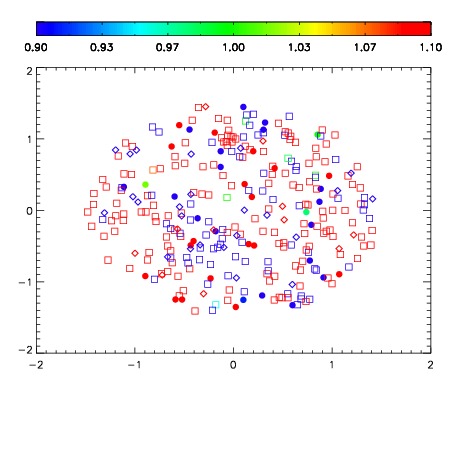
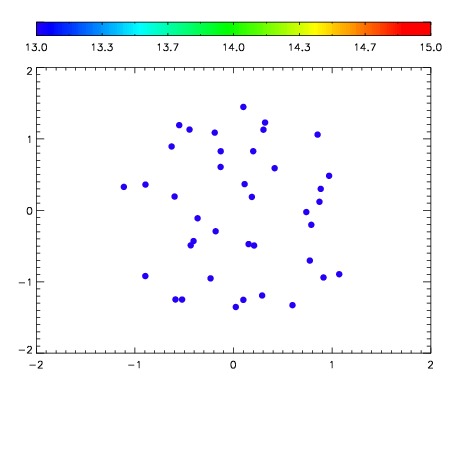

| Frame | Nreads | Zeropoints | Mag plots | Spatial mag deviation | Spatial sky 16325A emission deviations (filled: sky, open: star) | Spatial sky continuum emission | Spatial sky telluric CO2 absorption deviations (filled: H < 10) | |||||||||||||||||||||||
| 0 | 0 |
|
|
|
|
|
|
| IPAIR | NAME | SHIFT | NEWSHIFT | S/N | NAME | SHIFT | NEWSHIFT | S/N |
| 0 | 06400043 | 0.489588 | 0.00000 | 18.2988 | 06400038 | 0.00000 | 0.489588 | 18.4447 |
| 1 | 06400048 | 0.488440 | 0.00114799 | 18.6924 | 06400046 | -0.000196153 | 0.489784 | 18.6630 |
| 2 | 06400047 | 0.487386 | 0.00220200 | 18.6916 | 06400049 | 0.00378319 | 0.485805 | 18.6431 |
| 3 | 06400040 | 0.488915 | 0.000672996 | 18.4921 | 06400045 | 0.000905043 | 0.488683 | 18.5869 |
| 4 | 06400044 | 0.489488 | 9.99868e-05 | 18.4772 | 06400042 | 0.000143806 | 0.489444 | 18.5318 |
| 5 | 06400039 | 0.488474 | 0.00111398 | 18.4176 | 06400041 | 0.00166626 | 0.487922 | 18.4987 |