| Red | Green | Blue | |
| z | 17.64 | ||
| znorm | Inf | ||
| sky | -Inf | -Inf | -Inf |
| S/N | 28.4 | 50.2 | 53.2 |
| S/N(c) | 0.0 | 0.0 | 0.0 |
| SN(E/C) |

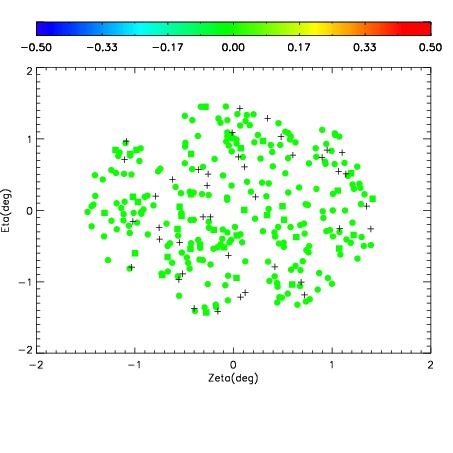

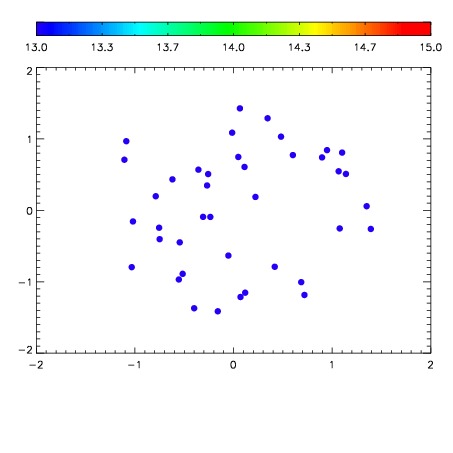

| Frame | Nreads | Zeropoints | Mag plots | Spatial mag deviation | Spatial sky 16325A emission deviations (filled: sky, open: star) | Spatial sky continuum emission | Spatial sky telluric CO2 absorption deviations (filled: H < 10) | |||||||||||||||||||||||
| 0 | 0 |
|
|
|
|
|
|
| IPAIR | NAME | SHIFT | NEWSHIFT | S/N | NAME | SHIFT | NEWSHIFT | S/N |
| 0 | 06100061 | 0.489226 | 0.00000 | 18.8220 | 06100067 | -0.00257990 | 0.491806 | 18.8911 |
| 1 | 06100060 | 0.488545 | 0.000681013 | 18.9563 | 06100059 | 0.00000 | 0.489226 | 18.8916 |
| 2 | 06100065 | 0.488120 | 0.00110602 | 18.7986 | 06100062 | 5.08027e-05 | 0.489175 | 18.7980 |
| 3 | 06100064 | 0.487827 | 0.00139901 | 18.7071 | 06100066 | -0.00122621 | 0.490452 | 18.7950 |
| 4 | 06100068 | 0.486871 | 0.00235501 | 18.5907 | 06100070 | -0.000513927 | 0.489740 | 18.5130 |
| 5 | 06100069 | 0.487140 | 0.00208601 | 18.5220 | 06100063 | -0.000355666 | 0.489582 | 18.4742 |