| Red | Green | Blue | |
| z | 17.64 | ||
| znorm | Inf | ||
| sky | -NaN | -Inf | -Inf |
| S/N | 32.8 | 56.0 | 58.7 |
| S/N(c) | 0.0 | 0.0 | 0.0 |
| SN(E/C) |
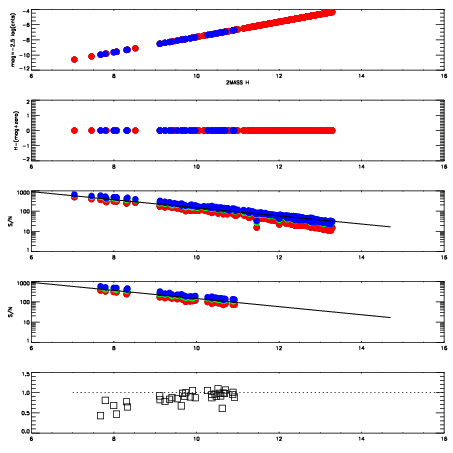
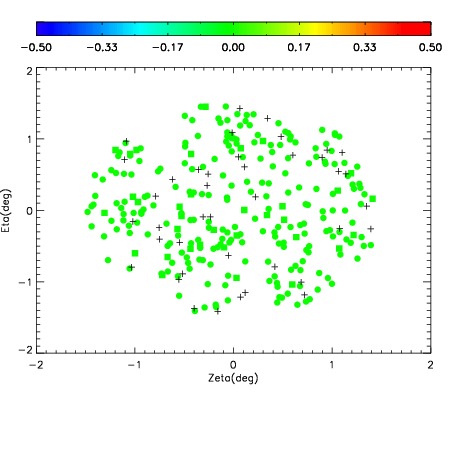
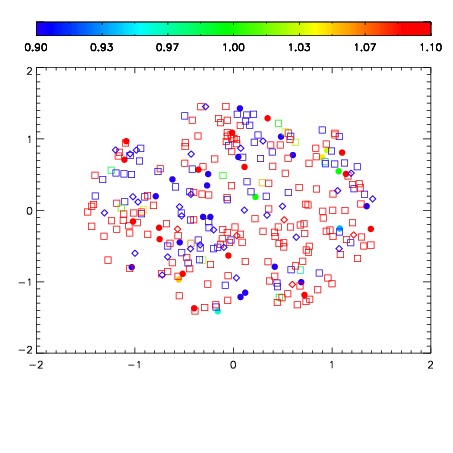


| Frame | Nreads | Zeropoints | Mag plots | Spatial mag deviation | Spatial sky 16325A emission deviations (filled: sky, open: star) | Spatial sky continuum emission | Spatial sky telluric CO2 absorption deviations (filled: H < 10) | |||||||||||||||||||||||
| 0 | 0 |
|
|
|
|
|
|
| IPAIR | NAME | SHIFT | NEWSHIFT | S/N | NAME | SHIFT | NEWSHIFT | S/N |
| 0 | 06410052 | 0.480371 | 0.00000 | 19.0465 | 06410042 | 0.00000 | 0.480371 | 19.0083 |
| 1 | 06410051 | 0.479793 | 0.000577986 | 19.1124 | 06410053 | -5.44260e-05 | 0.480425 | 19.1768 |
| 2 | 06410044 | 0.478872 | 0.00149900 | 18.9832 | 06410050 | 0.00229932 | 0.478072 | 19.0083 |
| 3 | 06410043 | 0.478983 | 0.00138798 | 18.9635 | 06410045 | 0.00247059 | 0.477900 | 18.9063 |
| 4 | 06410047 | 0.479822 | 0.000548989 | 18.9363 | 06410049 | 0.00294766 | 0.477423 | 18.8649 |
| 5 | 06410048 | 0.479960 | 0.000411004 | 18.6765 | 06410046 | 0.00111293 | 0.479258 | 18.8557 |