| Red | Green | Blue | |
| z | 17.64 | ||
| znorm | Inf | ||
| sky | -NaN | -Inf | -Inf |
| S/N | 25.7 | 46.1 | 48.4 |
| S/N(c) | 0.0 | 0.0 | 0.0 |
| SN(E/C) |

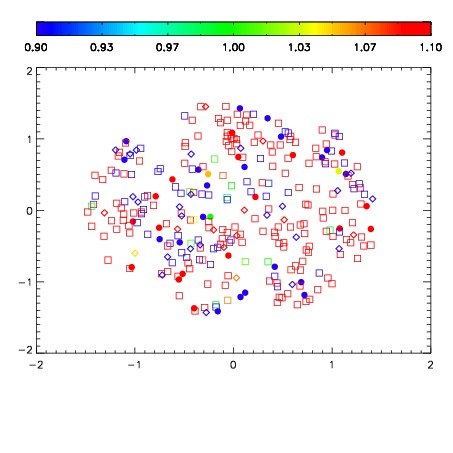
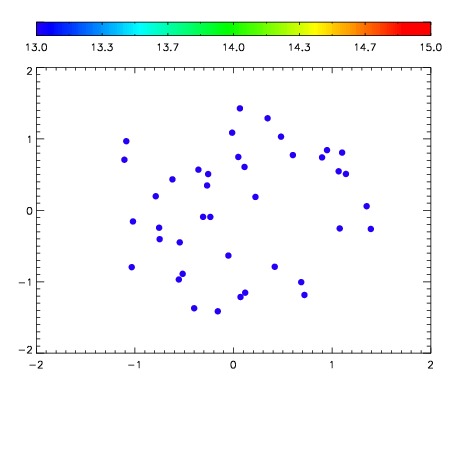

| Frame | Nreads | Zeropoints | Mag plots | Spatial mag deviation | Spatial sky 16325A emission deviations (filled: sky, open: star) | Spatial sky continuum emission | Spatial sky telluric CO2 absorption deviations (filled: H < 10) | |||||||||||||||||||||||
| 0 | 0 |
|
|
|
|
|
|
| IPAIR | NAME | SHIFT | NEWSHIFT | S/N | NAME | SHIFT | NEWSHIFT | S/N |
| 0 | 06610049 | 0.483658 | 0.00000 | 19.0414 | 06610050 | 0.000419293 | 0.483239 | 19.0203 |
| 1 | 06610053 | 0.482262 | 0.00139600 | 19.0871 | 06610054 | -0.000607231 | 0.484265 | 19.1049 |
| 2 | 06610052 | 0.481708 | 0.00195000 | 19.0553 | 06610047 | 0.00000 | 0.483658 | 19.0424 |
| 3 | 06610048 | 0.483618 | 3.99947e-05 | 19.0427 | 06610051 | -0.00114521 | 0.484803 | 19.0380 |